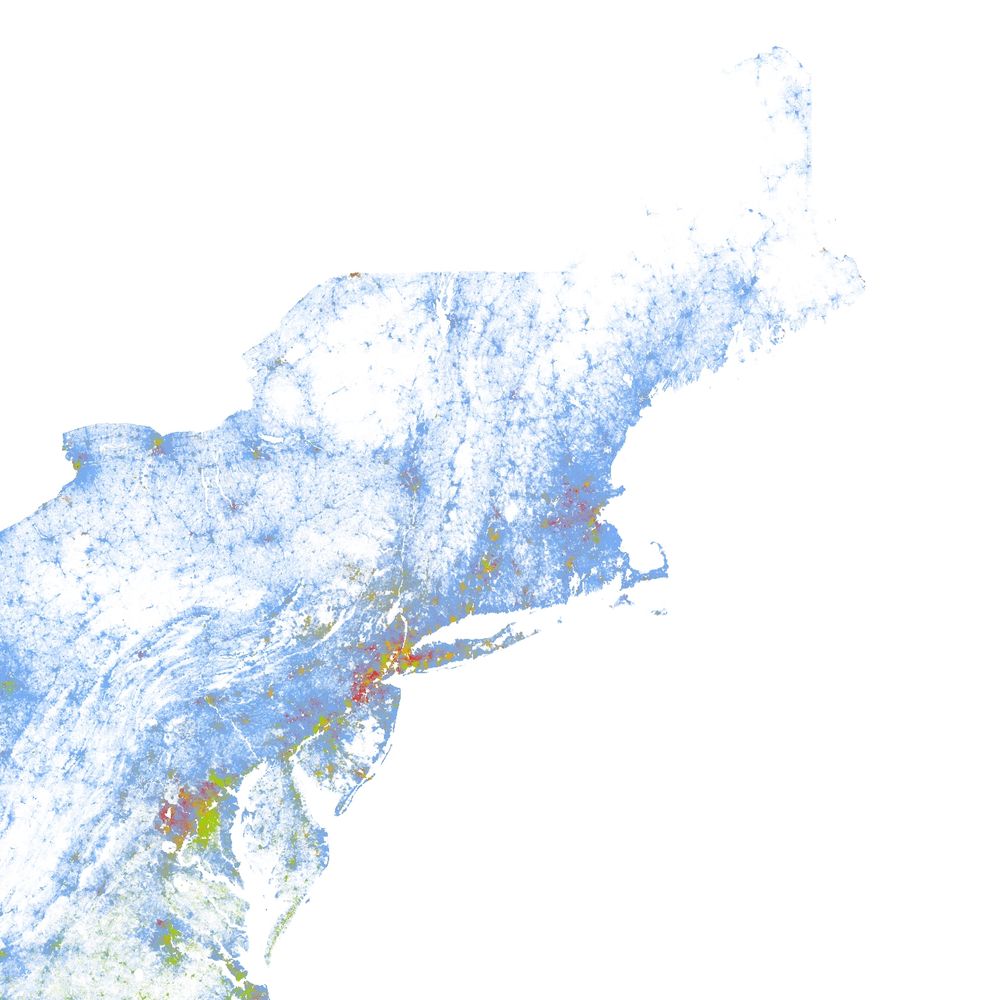
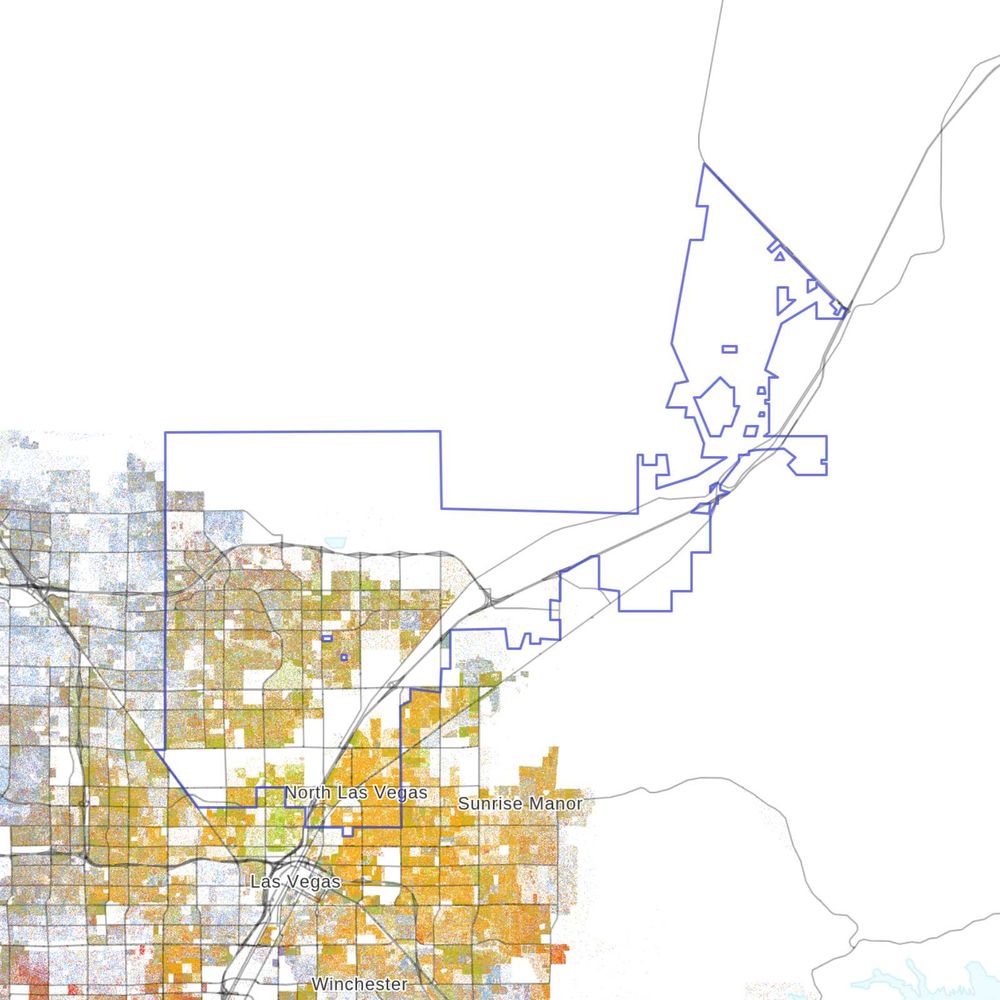
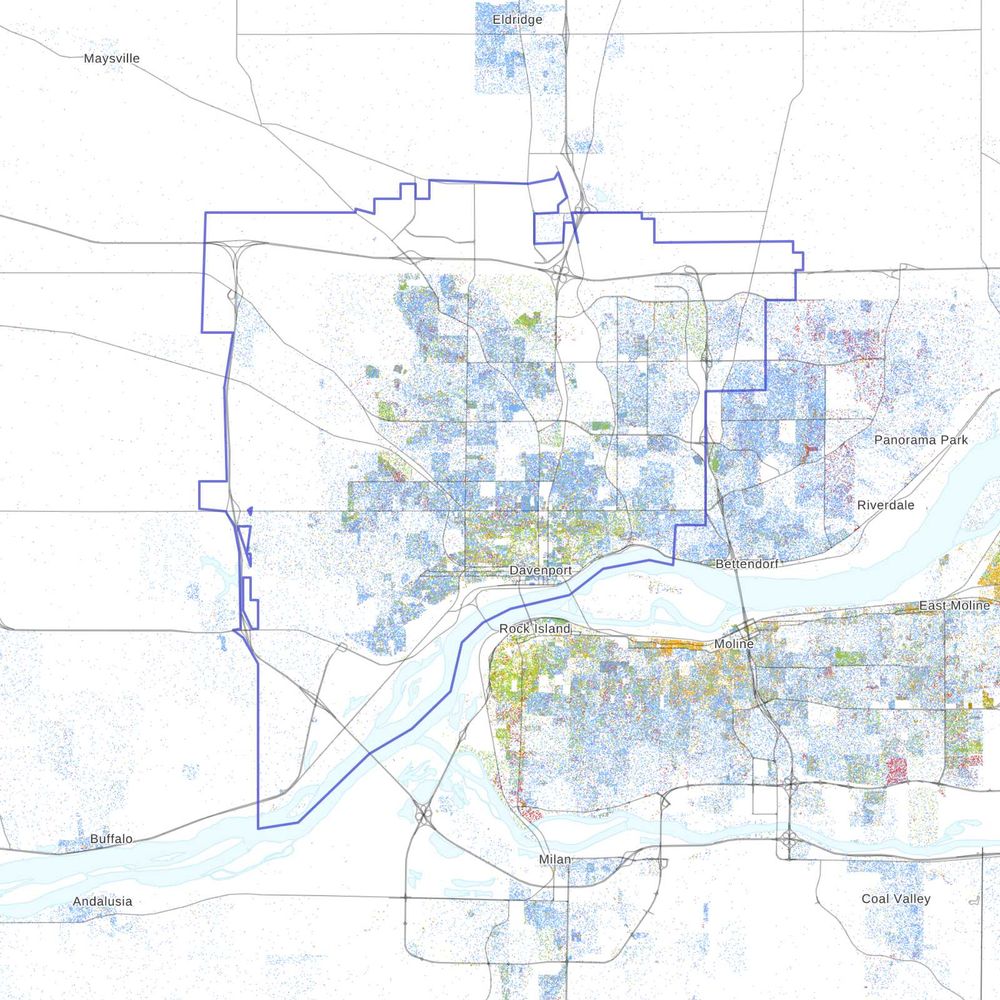
Census Dots
@censusdots.bsky.social
22 followers 100 following 77 posts
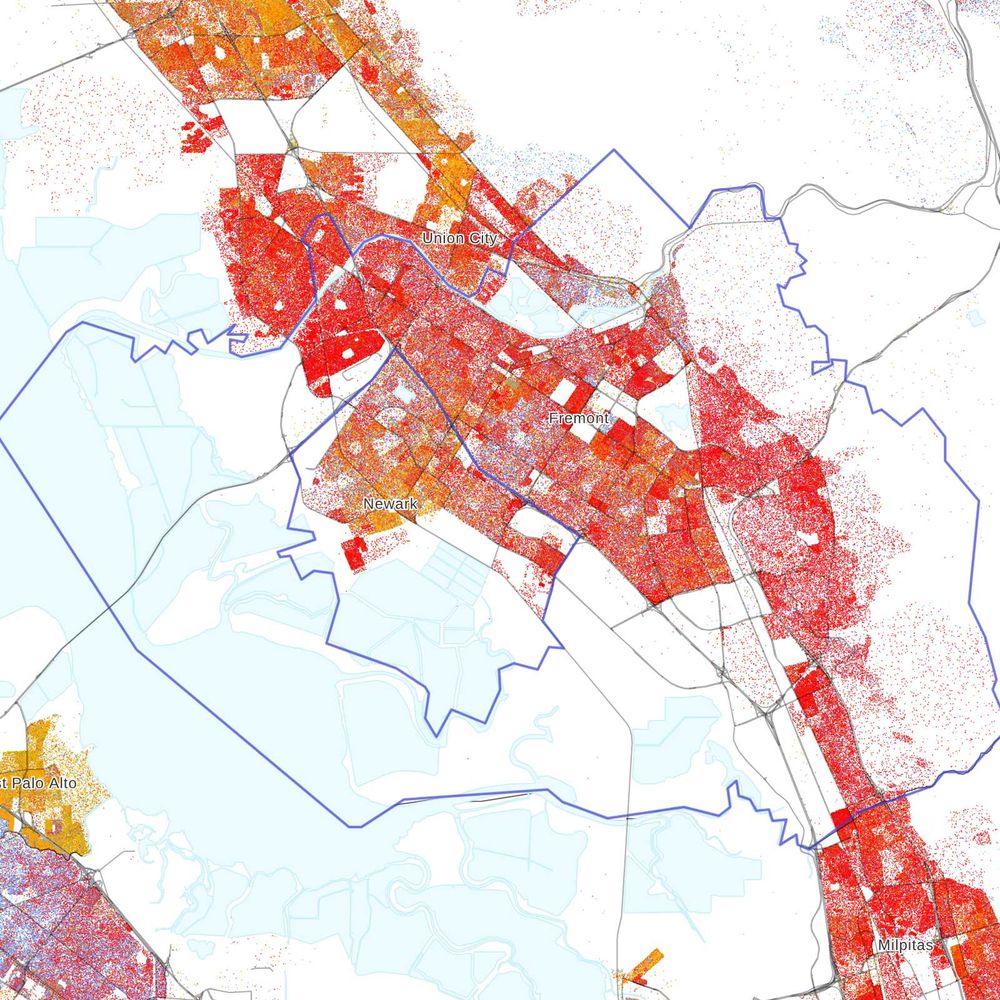
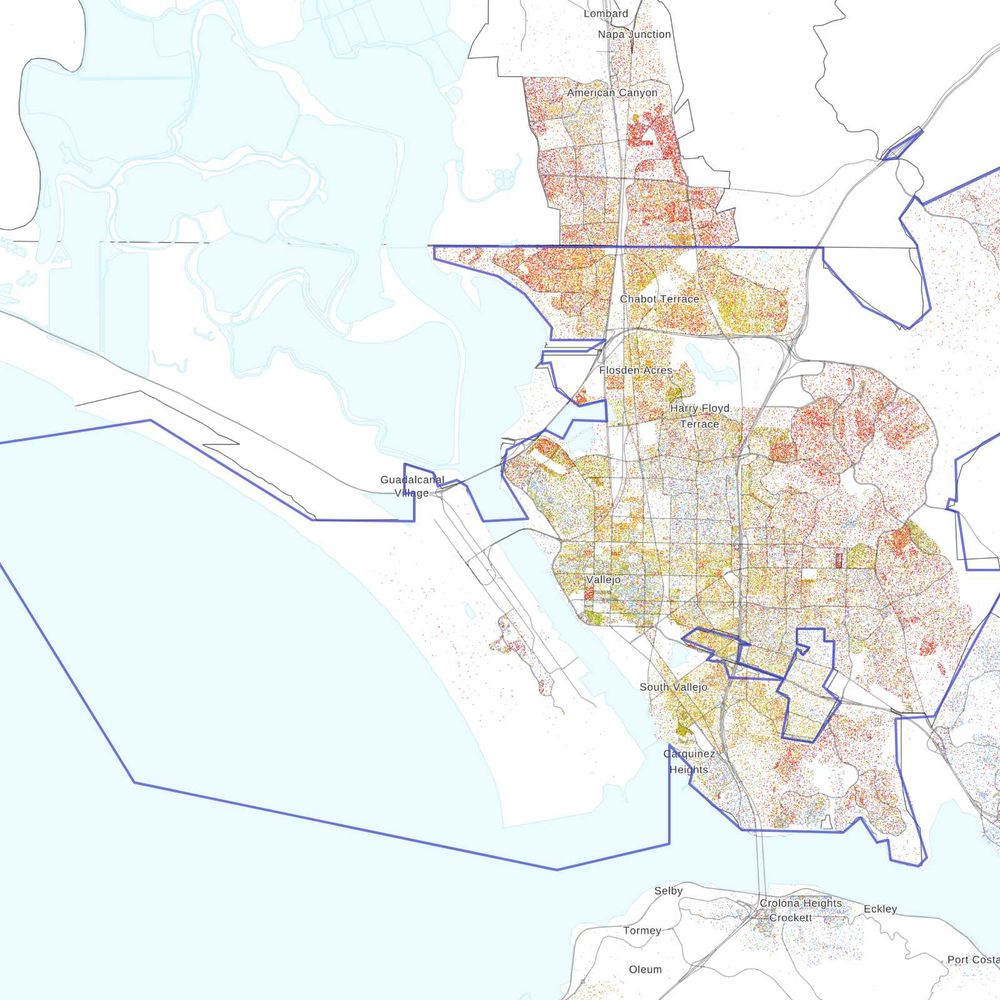
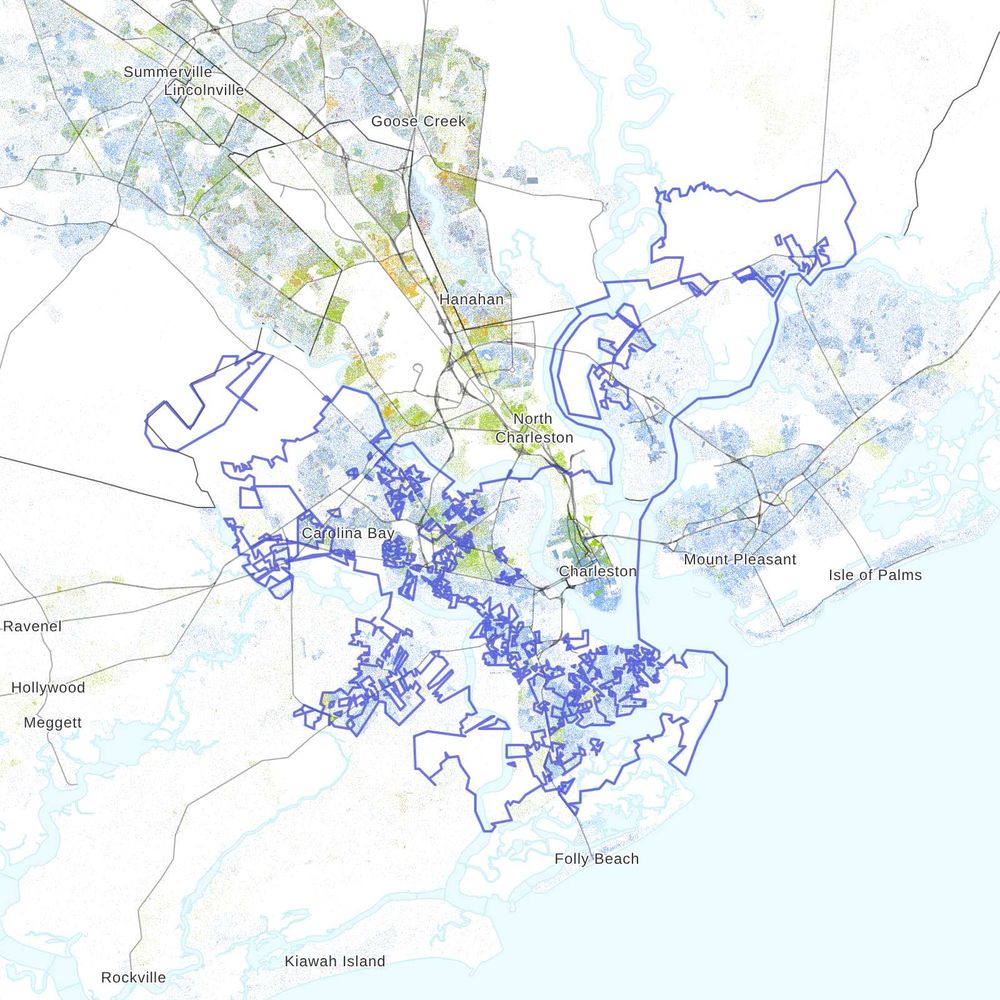
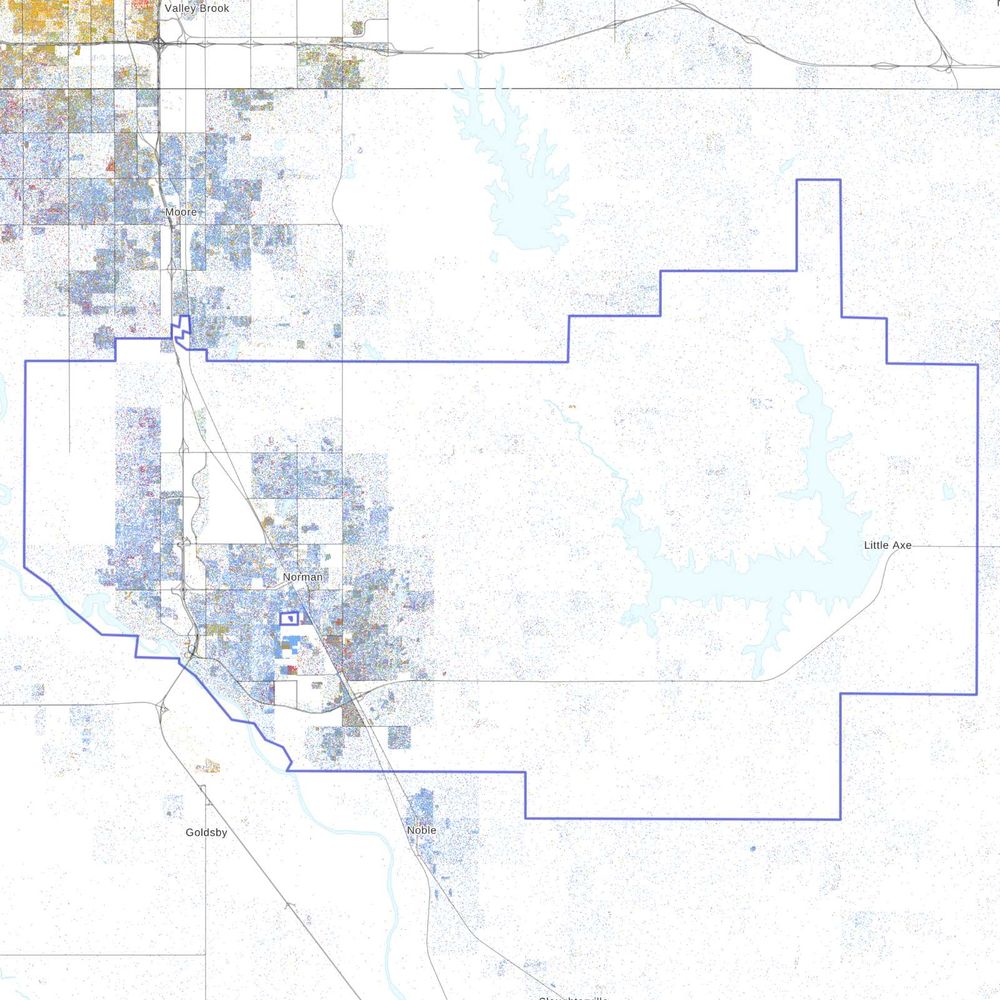
A map from https://censusdots.com/ shared daily
Posts Media Videos Starter Packs
censusdots.bsky.social
A dot map of Fremont, CA's population by race, created using data from the 2020 US Census.

🔵 = White, 🟢 = Black, 🟠 = Hispanic, 🔴 = Asian, 🟤 = Native American/Other, 🟣 = Multiracial

Explore the map: https://www.censusdots.com/race/fremont-ca-demographics?src=bluesky
A dot map of Fremont, CA's population by race
censusdots.bsky.social
A dot map of Boca Raton, FL's population by race, created using data from the 2020 US Census.

🔵 = White, 🟢 = Black, 🟠 = Hispanic, 🔴 = Asian, 🟤 = Native American/Other, 🟣 = Multiracial

Explore the map: https://www.censusdots.com/race/boca-raton-fl-demographics?src=bluesky
A dot map of Boca Raton, FL's population by race
censusdots.bsky.social
A dot map of Charlotte, NC's population by race, created using data from the 2020 US Census.

🔵 = White, 🟢 = Black, 🟠 = Hispanic, 🔴 = Asian, 🟤 = Native American/Other, 🟣 = Multiracial

Explore the map: https://www.censusdots.com/race/charlotte-nc-demographics?src=bluesky
A dot map of Charlotte, NC's population by race
censusdots.bsky.social
A dot map of Columbus, GA's population by race, created using data from the 2020 US Census.

🔵 = White, 🟢 = Black, 🟠 = Hispanic, 🔴 = Asian, 🟤 = Native American/Other, 🟣 = Multiracial

Explore the map: https://www.censusdots.com/race/columbus-ga-demographics?src=bluesky
A dot map of Columbus, GA's population by race
censusdots.bsky.social
A dot map of Vallejo, CA's population by race, created using data from the 2020 US Census.

🔵 = White, 🟢 = Black, 🟠 = Hispanic, 🔴 = Asian, 🟤 = Native American/Other, 🟣 = Multiracial

Explore the map: https://www.censusdots.com/race/vallejo-ca-demographics?src=bluesky
A dot map of Vallejo, CA's population by race
censusdots.bsky.social
A dot map of Victorville, CA's population by race, created using data from the 2020 US Census.

🔵 = White, 🟢 = Black, 🟠 = Hispanic, 🔴 = Asian, 🟤 = Native American/Other, 🟣 = Multiracial

Explore the map: https://www.censusdots.com/race/victorville-ca-demographics?src=bluesky
A dot map of Victorville, CA's population by race
censusdots.bsky.social
A dot map of Charleston, SC's population by race, created using data from the 2020 US Census.

🔵 = White, 🟢 = Black, 🟠 = Hispanic, 🔴 = Asian, 🟤 = Native American/Other, 🟣 = Multiracial

Explore the map: https://www.censusdots.com/race/charleston-sc-demographics?src=bluesky
A dot map of Charleston, SC's population by race
censusdots.bsky.social
A dot map of Elgin, IL's population by race, created using data from the 2020 US Census.

🔵 = White, 🟢 = Black, 🟠 = Hispanic, 🔴 = Asian, 🟤 = Native American/Other, 🟣 = Multiracial

Explore the map: https://www.censusdots.com/race/elgin-il-demographics?src=bluesky
A dot map of Elgin, IL's population by race
censusdots.bsky.social
A dot map of McKinney, TX's population by race, created using data from the 2020 US Census.

🔵 = White, 🟢 = Black, 🟠 = Hispanic, 🔴 = Asian, 🟤 = Native American/Other, 🟣 = Multiracial

Explore the map: https://www.censusdots.com/race/mc-kinney-tx-demographics?src=bluesky
A dot map of McKinney, TX's population by race
censusdots.bsky.social
A dot map of Detroit, MI's population by race, created using data from the 2020 US Census.

🔵 = White, 🟢 = Black, 🟠 = Hispanic, 🔴 = Asian, 🟤 = Native American/Other, 🟣 = Multiracial

Explore the map: https://www.censusdots.com/race/detroit-mi-demographics?src=bluesky
A dot map of Detroit, MI's population by race
censusdots.bsky.social
A dot map of Huntington Beach, CA's population by race, created using data from the 2020 US Census.

🔵 = White, 🟢 = Black, 🟠 = Hispanic, 🔴 = Asian, 🟤 = Native American/Other, 🟣 = Multiracial

Explore the map: https://www.censusdots.com/race/huntington-beach-ca-demographics?src=bluesky
A dot map of Huntington Beach, CA's population by race
censusdots.bsky.social
A dot map of Raleigh, NC's population by race, created using data from the 2020 US Census.

🔵 = White, 🟢 = Black, 🟠 = Hispanic, 🔴 = Asian, 🟤 = Native American/Other, 🟣 = Multiracial

Explore the map: https://www.censusdots.com/race/raleigh-nc-demographics?src=bluesky
A dot map of Raleigh, NC's population by race
censusdots.bsky.social
A dot map of Norman, OK's population by race, created using data from the 2020 US Census.

🔵 = White, 🟢 = Black, 🟠 = Hispanic, 🔴 = Asian, 🟤 = Native American/Other, 🟣 = Multiracial

Explore the map: https://www.censusdots.com/race/norman-ok-demographics?src=bluesky
A dot map of Norman, OK's population by race
censusdots.bsky.social
A dot map of Hartford, CT's population by race, created using data from the 2020 US Census.

🔵 = White, 🟢 = Black, 🟠 = Hispanic, 🔴 = Asian, 🟤 = Native American/Other, 🟣 = Multiracial

Explore the map: https://www.censusdots.com/race/hartford-ct-demographics?src=bluesky
A dot map of Hartford, CT's population by race
censusdots.bsky.social
A dot map of Savannah, GA's population by race, created using data from the 2020 US Census.

🔵 = White, 🟢 = Black, 🟠 = Hispanic, 🔴 = Asian, 🟤 = Native American/Other, 🟣 = Multiracial

Explore the map: https://www.censusdots.com/race/savannah-ga-demographics?src=bluesky
A dot map of Savannah, GA's population by race
censusdots.bsky.social
A dot map of Sunnyvale, CA's population by race, created using data from the 2020 US Census.

🔵 = White, 🟢 = Black, 🟠 = Hispanic, 🔴 = Asian, 🟤 = Native American/Other, 🟣 = Multiracial

Explore the map: https://www.censusdots.com/race/sunnyvale-ca-demographics?src=bluesky
A dot map of Sunnyvale, CA's population by race
censusdots.bsky.social
A dot map of Modesto, CA's population by race, created using data from the 2020 US Census.

🔵 = White, 🟢 = Black, 🟠 = Hispanic, 🔴 = Asian, 🟤 = Native American/Other, 🟣 = Multiracial

Explore the map: https://www.censusdots.com/race/modesto-ca-demographics?src=bluesky
A dot map of Modesto, CA's population by race
censusdots.bsky.social
A dot map of Visalia, CA's population by race, created using data from the 2020 US Census.

🔵 = White, 🟢 = Black, 🟠 = Hispanic, 🔴 = Asian, 🟤 = Native American/Other, 🟣 = Multiracial

Explore the map: https://www.censusdots.com/race/visalia-ca-demographics?src=bluesky
A dot map of Visalia, CA's population by race
censusdots.bsky.social
A dot map of Fort Lauderdale, FL's population by race, created using data from the 2020 US Census.

🔵 = White, 🟢 = Black, 🟠 = Hispanic, 🔴 = Asian, 🟤 = Native American/Other, 🟣 = Multiracial

Explore the map: https://www.censusdots.com/race/fort-lauderdale-fl-demographics?src=bluesky
A dot map of Fort Lauderdale, FL's population by race
censusdots.bsky.social
A dot map of Yonkers, NY's population by race, created using data from the 2020 US Census.

🔵 = White, 🟢 = Black, 🟠 = Hispanic, 🔴 = Asian, 🟤 = Native American/Other, 🟣 = Multiracial

Explore the map: https://www.censusdots.com/race/yonkers-ny-demographics?src=bluesky
A dot map of Yonkers, NY's population by race
censusdots.bsky.social
A dot map of North Las Vegas, NV's population by race, created using data from the 2020 US Census.

🔵 = White, 🟢 = Black, 🟠 = Hispanic, 🔴 = Asian, 🟤 = Native American/Other, 🟣 = Multiracial

Explore the map: https://www.censusdots.com/race/north-las-vegas-nv-demographics?src=bluesky
A dot map of North Las Vegas, NV's population by race
censusdots.bsky.social
A dot map of Davenport, IA's population by race, created using data from the 2020 US Census.

🔵 = White, 🟢 = Black, 🟠 = Hispanic, 🔴 = Asian, 🟤 = Native American/Other, 🟣 = Multiracial

Explore the map: https://www.censusdots.com/race/davenport-ia-demographics?src=bluesky
A dot map of Davenport, IA's population by race
censusdots.bsky.social
A dot map of Atlanta, GA's population by race, created using data from the 2020 US Census.

🔵 = White, 🟢 = Black, 🟠 = Hispanic, 🔴 = Asian, 🟤 = Native American/Other, 🟣 = Multiracial

Explore the map: https://www.censusdots.com/race/atlanta-ga-demographics?src=bluesky
A dot map of Atlanta, GA's population by race
censusdots.bsky.social
A dot map of Pasadena, CA's population by race, created using data from the 2020 US Census.

🔵 = White, 🟢 = Black, 🟠 = Hispanic, 🔴 = Asian, 🟤 = Native American/Other, 🟣 = Multiracial

Explore the map: https://www.censusdots.com/race/pasadena-ca-demographics?src=bluesky
A dot map of Pasadena, CA's population by race
censusdots.bsky.social
A dot map of Temecula, CA's population by race, created using data from the 2020 US Census.

🔵 = White, 🟢 = Black, 🟠 = Hispanic, 🔴 = Asian, 🟤 = Native American/Other, 🟣 = Multiracial

Explore the map: https://www.censusdots.com/race/temecula-ca-demographics?src=bluesky
A dot map of Temecula, CA's population by race