Michał Wypych
@mwypych.bsky.social
150 followers 1.1K following 62 posts
R / Shiny dev Background in academia #rstats | #python | #dataviz | #rshiny https://mic-wypych.github.io/
Posts Media Videos Starter Packs
mwypych.bsky.social
There's also formr which is free and integrates nicely with R. You'd probably need to set up your own instance because their servers are already full bit they give detailed instructions: formr.org
formr - an online survey framework with live feedback
formr survey framework. chain simple surveys into long runs, use the power of R to generate pretty feedback and complex designs
formr.org
mwypych.bsky.social
Basketball #tidytuesday

Adventures in {grid} part 2, tried to make a basketball court.

code: github.com/mic-wypych/t...

#rstats | #dataviz | #ggplot2
A plot showing eurobasket teams that made it to final four or won a title on plot styled as a basketbal lcourt
mwypych.bsky.social
only a week late to #Tidytuesday!

I started learning {grid} and while it's great its. so. many. iterations. One thing I learned so far: always draw by hand before coding!

#rstats | #dataviz | #ggplot2
A combination of heatmap and stacked bar chart showing share of men & women chess players across games played and ranking in september 2025. Data from FIDE
mwypych.bsky.social
#tidytuesday

I looked at most active frog spotters and made a hopping cumulative plot.

code: github.com/mic-wypych/t...

#rstats #dataviz #ggplot2
mwypych.bsky.social
Moving to Mac has NOT been fun so far
mwypych.bsky.social
I just won a very unfair battle with {renv} and I'm really proud.
Only had to reinstall R, add 4 system level dependencies and a few other things along the way...
#rstats
mwypych.bsky.social
Thanks, this is so nice of you! I already returned my copy and ordered a new one which is on its way to me 🙂
mwypych.bsky.social
Thanks! 🙂 That's exactly what I did, the second book is already on its way. Hope it's twice the charm this time.
mwypych.bsky.social
Thanks! Eventually I just returned my copy and ordered a new one.
mwypych.bsky.social
Thanks! I hope they might better convey the message
mwypych.bsky.social
I feel you :( I just got a different CRC book and it came B&W too.
mwypych.bsky.social
Another #tidytuesday.

I looked at inequality data for Poland from 1986 to 2023.
This one was largely inspired by W.E.B. Du Bois.

code: github.com/mic-wypych/t...

I love {ggforce} and the myriad options it opens.

#rstats #dataviz #ggplot2
A plot showing gini coefficient in Poland from 1986 to 2023 and major events from Polish history from that period. Gini (tax adjusted) was generally around .3. The plot is red and black, in style inspired by W.E.B. Du Bois
mwypych.bsky.social
Thanks! I was a little worried I bought some other version by accident.
mwypych.bsky.social
Yes! Mine looks like this:
mwypych.bsky.social
I just got my copy of "Chart Art" for which I was super excited! The book arrived... but it's all in black and white. I'm not sure if the book is actually black and white (the reviews seems to suggest its not?) or sth is wrong with my copy?

Has this happened to anyone?

#dataviz #datavisualization
mwypych.bsky.social
Thanks! This looks super cool, and I do love good scrollytelling. I really like how they show why those songs are shorter and what they cut.
mwypych.bsky.social
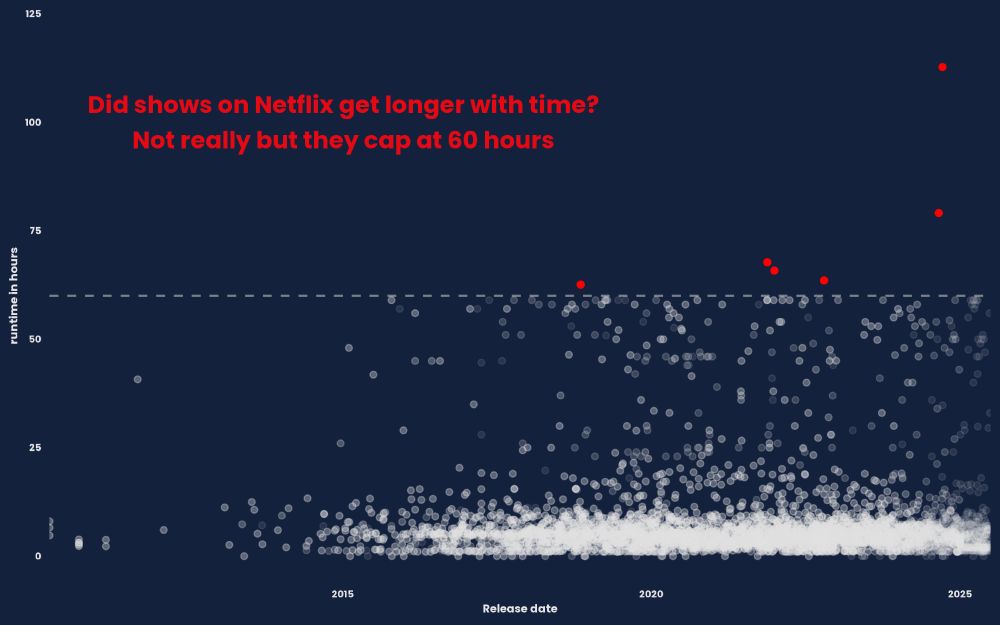
Thanks! Yea I don't think there is some "big reason" behind it. I just found it weird that it cuts so sharply at 60 hours. I would expect more shows with a little over 60. And those longer shows are probably mostly soap operas. E.g. those longest ones are all Colombian telenovelas.
mwypych.bsky.social
#tidytuesday

Did shows on Netflix get longer with time? Not really but interestingly they cap at 60 hours with very few longer shows.

code: github.com/mic-wypych/t...

#rstats #ggplot2 #dataviz
a plot that shows runtime in hours vs release date of netflix shows. Just a few are longer than 60 hours but a lot are just under 60 hours with majority being much shorter (under 25 hours)
mwypych.bsky.social
#Tidytuesday

I looked at categories of funding of British Library. Sadly, all of them are down in 2023 with the peak in funding in 2006.

code: github.com/mic-wypych/t...

#rstats | #ggplot2 | #dataviz
A plot showing changes in funding of British library through categories of funding: GIA, investment, voluntary, services and others from 1998 to 2023. Sadly funding across all categories is down.
mwypych.bsky.social
#tidytuesday about colors from the xkcd color survey!

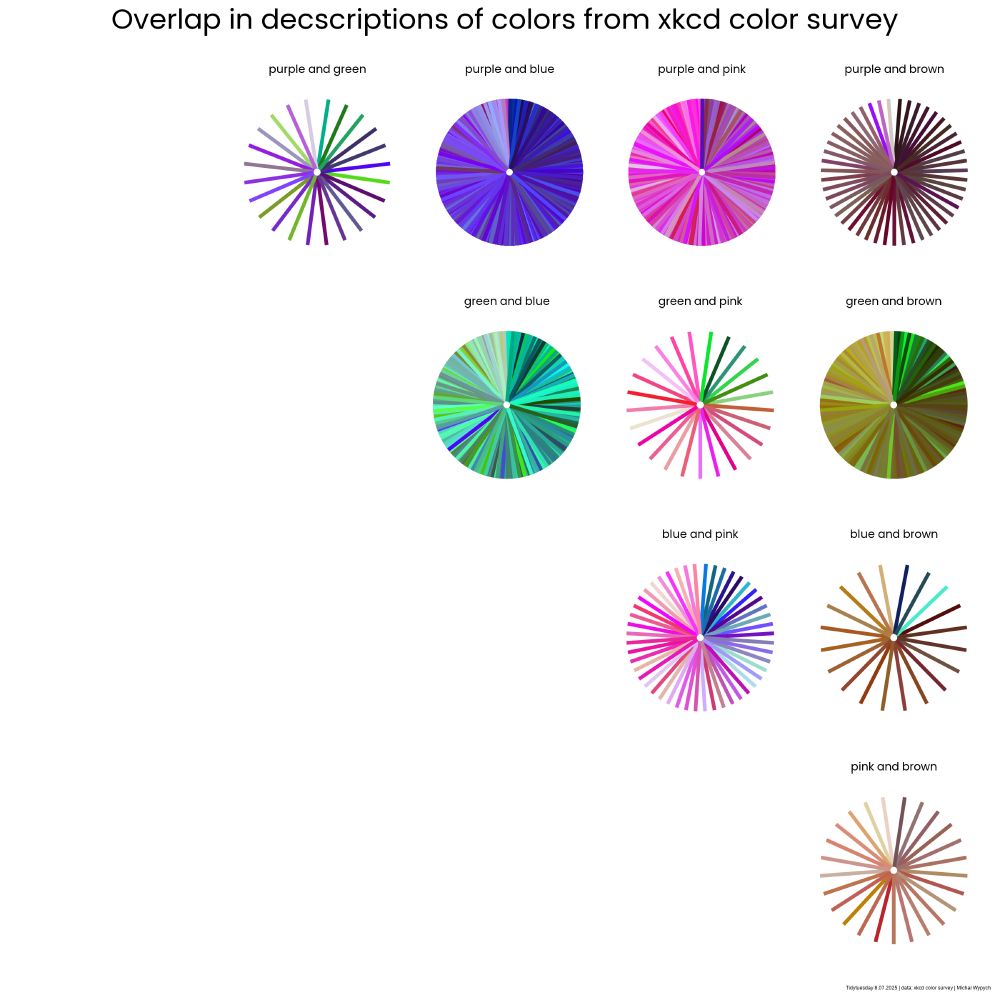
Colors are always fun to work with. I looked at overlaps in descriptions of colors given by participants of the survey.

code: github.com/mic-wypych/t...

#rstats #dataviz #ggplot2
a plot showing overlaps in descriptions of colors (purple, pink, blue, brown and green) from the xkcd color survey
mwypych.bsky.social
This #Tidytuesday I looked at weekly gasoline prices in EU and US and the 2014 and 2022 invasions by Russia. Data for EU grabbed from EU weekly oil bulletin

If you want to support Ukraine and brush up some data skills consider Workshops for Ukraine by @dariia.bsky.social!

#ggplot2 #dataviz #rstats
The plot shows a trend of weekly gasoline prices in EU and US from 2013 to 2025 and highlights Russian annexation of Crimea and Russian invasion from 2022. While there was little impact in 2014 there was a significant spike in prices after the 2022 invasion started.
mwypych.bsky.social
Thank you! The legend actually gave me quite a headache. Apparently {gganimate} and {patchwork} do not like each other.
mwypych.bsky.social
For this #TidyTuesday I made an animation showing measles lab confirmed cases per 100k in EU.

Animation with {gganimate}, legend added with weird {magick} tricks.
I'm not fully satisfied with this one, working with animations is tough!

code: github.com/mic-wypych/t...

#rstats #ggplot2 #dataviz