V-Dem Institute
@vdeminstitute.bsky.social
1.5K followers 270 following 160 posts
The V-Dem Institute is an independent research institute and the Headquarters of the V-Dem project, based at the University of Gothenburg, Sweden. The V-Dem project (Varieties of Democracy) is a unique approach to conceptualizing and measuring democracy.
Posts Media Videos Starter Packs
vdeminstitute.bsky.social
The latest blow further deepening Tunisia’s authoritarian turn came in 2025 when Saïed’s government dissolved the National Authority for Access to Information (INAI), severely undermining transparency and oversight.

Make your own graph: v-dem.net/graphing/gra...
5(5)
@vdemamlat.bsky.social
Graphing Tools – V-Dem
v-dem.net
vdeminstitute.bsky.social
He used the COVID-19 pandemic to expand executive power, culminating in a self-coup July 2021. 2022, the constitution was revised, reinforcing the president's powers. The independence of the judiciary has eroded, & political opponents, journalists, & dissent voices face increasing persecution.
4(5)
vdeminstitute.bsky.social
However, socioeconomic challenges, corruption, a lack of accountability mechanisms, and unresolved issues in gender inequality challenged Tunisia’s fragile democracy. With Kaïs Saïed winning the presidential elections in 2019, he gradually steered Tunisia into democratic backsliding.
3(5)
vdeminstitute.bsky.social
Tunisia emerged as the Arab Spring’s democratic success story after the long autocratic rule of Pres. Ben Ali ended in 2011. A progressive new constitution, political rights & civil liberties, a series of free multiparty elections, separation of powers, & freedom of expression fueled optimism.
2(5)
vdeminstitute.bsky.social
📉 #GotW From Hope to Backsliding in #Tunisia
This week’s graph shows the democratic reversal in Tunisia 2010 to 2024. The 4 indices evaluate democracy on a scale from 0 (less democratic) to 1 (more democratic).
Full text with references: v-dem.net/weekly_graph...
#Polisky #PoliticalScienceData
🧵1(5)
The image is a graph showing four V-Dem indices for Tunisia from 2010 to 2024, on a scale from 0 (less democratic) to 1 (more democratic). The Civil society participation index, the Freedom of expression index, the Judicial constraints on the executive index, and the Liberal Democracy Index all show sharp upward turns in 2010 to 2012, remaining stable on a high level until they all decline from 2021 and onward, many of them sharply.
vdeminstitute.bsky.social
Make your own graph with the V-Dem graphing tools: v-dem.net/graphing/gra...
Read more in the Policy Brief "U-turns – The Hope for Democratic Resilience":
v-dem.net/media/public...
or in "When autocratization is reversed: episodes of U-Turns since 1900": www.tandfonline.com/doi/full/10....
7(7)
Graphing Tools – V-Dem
v-dem.net
vdeminstitute.bsky.social
Both countries are democratizing, but the positive trend has been weakened in recent years by incidents of suppression of political opponents. The upcoming elections in 2026, will give the people of The Gambia and Zambia the opportunity to solidify and deepen their ongoing democratization.
6(7)
vdeminstitute.bsky.social
In 2021, opposition leader Hakainde Hichilema defeats Lungu in the election with a landslide victory that initiates a U-turn democratization process. This case exemplifies the resilience of democracy, turning an autocratizing trend around.
5(7)
vdeminstitute.bsky.social
Zambia has a period of middling but stable levels in the EDI from 1995 to 2015. After the death of President Michael Sata 2015, Edgar Lungu wins the 2016 election. He introduces repressive measures against the opposition, the media, and civil society, leading to a decline in democracy levels.
4(7)
vdeminstitute.bsky.social
In The Gambia, the 22-year authoritarian period under Yahya Jammeh since the military coup 1994, ends in 2016 with the election of the opposition’s leader Adama Barrow. He introduces governance reforms, investigates the human rights abuses under Jammeh, and reinforces the separation of powers.
3(7)
vdeminstitute.bsky.social
The EDI focuses on the electoral components of democracy, assessing to what extent citizens can choose their leaders through free and fair elections, and whether there is freedom of expression during and between elections. The index ranges from 0 (less democratic) to 1 (more democratic).
2(7)
vdeminstitute.bsky.social
#GotW Electoral democracy in #TheGambia and #Zambia
The Gambia and Zambia have both recently improved in the Electoral Democracy Index (EDI). This week’s graph shows their performance between 1990 and 2024.
Full text w references @ v-dem.net/weekly_graph...
🧵1(7)
#PoliSky #PolDataSky #PoliSkyData
Image of a graph showing the V-Dem Electoral Democracy Index for The Gambia and Zambia for the years 1990 to 2024.
vdeminstitute.bsky.social
The 2025 constitutional amendments increase Ortega’s control over the executive, legislative, judicial, and electoral branches, asserting his autocratic rule over Nicaragua.
Make your own graph: v-dem.net/graphing/gra...
Full text w references: v-dem.net/weekly_graph...
@vdemamlat.bsky.social
6(6)
Graphing Tools – V-Dem
v-dem.net
vdeminstitute.bsky.social
Nicaragua is among the countries where journalists face the most severe difficulties. By 2024, mobilization for democracy is virtually nonexistent. Mobilization for autocracy also declined after 2019. The consolidation of a police state reinforced Nicaragua’s evolution toward autocracy.
5(6)
vdeminstitute.bsky.social
there is a simultaneous surge in mobilization for autocracy.
The government crackdown on the opposition continues after 2018, limiting the civic space and silencing dissenting voices. Authorities closed over 5,000 NGO's and more than 89 media outlets were forced to shut down.
4(6)
vdeminstitute.bsky.social
...on the social security and pension system triggered a wave of protests against President Daniel Ortega’s long-term authoritarian rule. In response, the Ortega regime mobilized loyalists to crackdown on anti-government movements. While mobilization for democracy reaches historic highs 2018,
3(6)
vdeminstitute.bsky.social
The indicators #MobilizationForAutocracy and #MobilizationForDemocracy assess mass mobilization events for and against democracy in terms of their frequency and size, ranging from 0 (virtually no events) to 4 (many small and large-scale events).
In 2018, mass mobilization surges when reforms...
2(6)
vdeminstitute.bsky.social
#GotW From the Streets to Silence: The collapse of democratic mobilization in #Nicaragua
This week’s graph shows the mobilization for autocracy and democracy in Nicaragua.
🧵1(6)
Full text with references: v-dem.net/weekly_graph...

#PoliSky #PoliSciSky #DemocracyAndAutocracy #PoliticalScienceData
Reposted by V-Dem Institute
medzihorsky.bsky.social
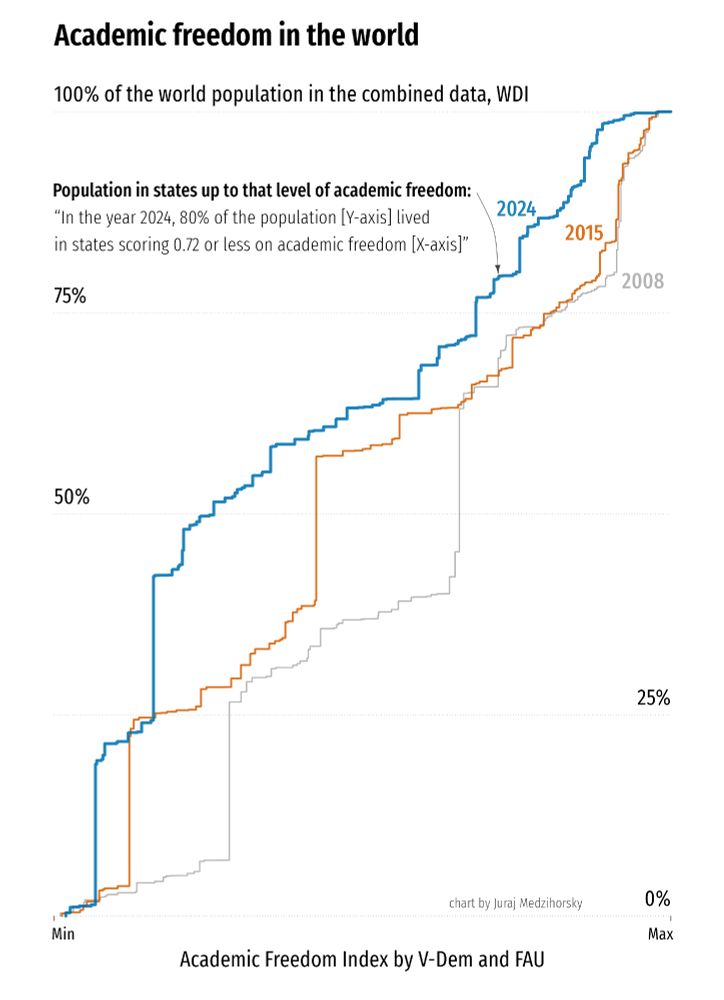
The global retrenchment of academic freedom, as estimated by V-Dem and FAU:

2008-2015: mostly at the lower part of the scale
2015-2024: the upper part of the scale moves as well

More by FAU at: academic-freedom-index.net

@vdeminstitute.bsky.social
A chart showing a summary of the Academic Freedom Index in 2008, 2015, and 2024.
vdeminstitute.bsky.social
Great use of our data😄 Although, if you include Eurovision 2025 countries that NQ for the final, the picture becomes slightly more muddled. Take f ex Azerbaijan (with a 0.05 score on the LDI), Serbia, who plays both teams (0.22), Georgia (0.33), or Montenegro (0.48). See all NQ countries in graph 👇
vdeminstitute.bsky.social
there is a low number of countries scoring moderately high. The growing number of countries scoring very low, illustrated by the shift from blue to yellow in the bottom right corner of the graph, is concering, especially looking at the last few years.
5(5)
@vdemamlat.bsky.social #VisualizingVDemData
vdeminstitute.bsky.social
After 1989, the tables have turned and it is the top of the graph that is red, indicating that 50 or more countries score high on the LDI.
While there have been significant improvements in democracy levels, measured by the number of countries scoring high on the LDI over the past 80 years,
4(5)
vdeminstitute.bsky.social
From 1945 to 1989, the bottom of the graph is red, showing that more than 50 countries scored low on the LDI each year. At the top of the graph, the same time period shows a gradual increase in countries scoring high on the LDI, from blue (very few) to orange (around 35 - 40 countries).
3(5)
vdeminstitute.bsky.social
The scale on the left side of the graph shows where counties score on the LDI, from low to high. The colors in the graph represent the number of countries for each score, ranging from dark blue (0) to dark red (50+). The timeline at the bottom shows the progression from 1945 to 2024.
2(5)