


Elisa Davis
@itselisadavis.bsky.social
Tableau, dataviz, #datafam, #B2VB. Internet forum native. Hoping this is a fun water cooler and not a mean or boring one.
Pinned
Well fancy seeing you here! Drop me a note when you get this so that I know you’ve made it over to the new fave hangout spot. Cheers! 🥂
New blog!
Behind the Corkboard: A Viz, A Vibe, and an Interview About Both open.substack.com/pub/itselisa...
Behind the Corkboard: A Viz, A Vibe, and an Interview About Both open.substack.com/pub/itselisa...

Behind the Corkboard: A Viz, A Vibe, and an Interview About Both
A conversation about the art and craft of data storytelling, my creative process, and why the messy version is worth sharing.
open.substack.com
May 2, 2025 at 6:58 PM
New blog!
Behind the Corkboard: A Viz, A Vibe, and an Interview About Both open.substack.com/pub/itselisa...
Behind the Corkboard: A Viz, A Vibe, and an Interview About Both open.substack.com/pub/itselisa...
Woooo! After years of 240 chars at a time I'm writing paragraphs. Thanks to everyone who's coming along for the (longform) ride. I appreciate you ❤️

April 28, 2025 at 7:11 PM
Woooo! After years of 240 chars at a time I'm writing paragraphs. Thanks to everyone who's coming along for the (longform) ride. I appreciate you ❤️
I've entered @tableaupublic.bsky.social's #Ironviz competition three times. Here's the complete judging feedback on my work. Check it out: open.substack.com/pub/itselisa...

April 25, 2025 at 2:26 PM
I've entered @tableaupublic.bsky.social's #Ironviz competition three times. Here's the complete judging feedback on my work. Check it out: open.substack.com/pub/itselisa...
Reposted by Elisa Davis

For fellow dataviz designers, datajournalists, data science nerds and whatnot, I've created a HUUUUGGGGEEE repository of data sources, public datasets, etc⬇️
pinto-pot-721.notion.site/Data-Sources...
pinto-pot-721.notion.site/Data-Sources...

Data/Sources Repo | Notion
Public Datasets & Resources
pinto-pot-721.notion.site
March 25, 2025 at 7:39 AM
For fellow dataviz designers, datajournalists, data science nerds and whatnot, I've created a HUUUUGGGGEEE repository of data sources, public datasets, etc⬇️
pinto-pot-721.notion.site/Data-Sources...
pinto-pot-721.notion.site/Data-Sources...
Reposted by Elisa Davis

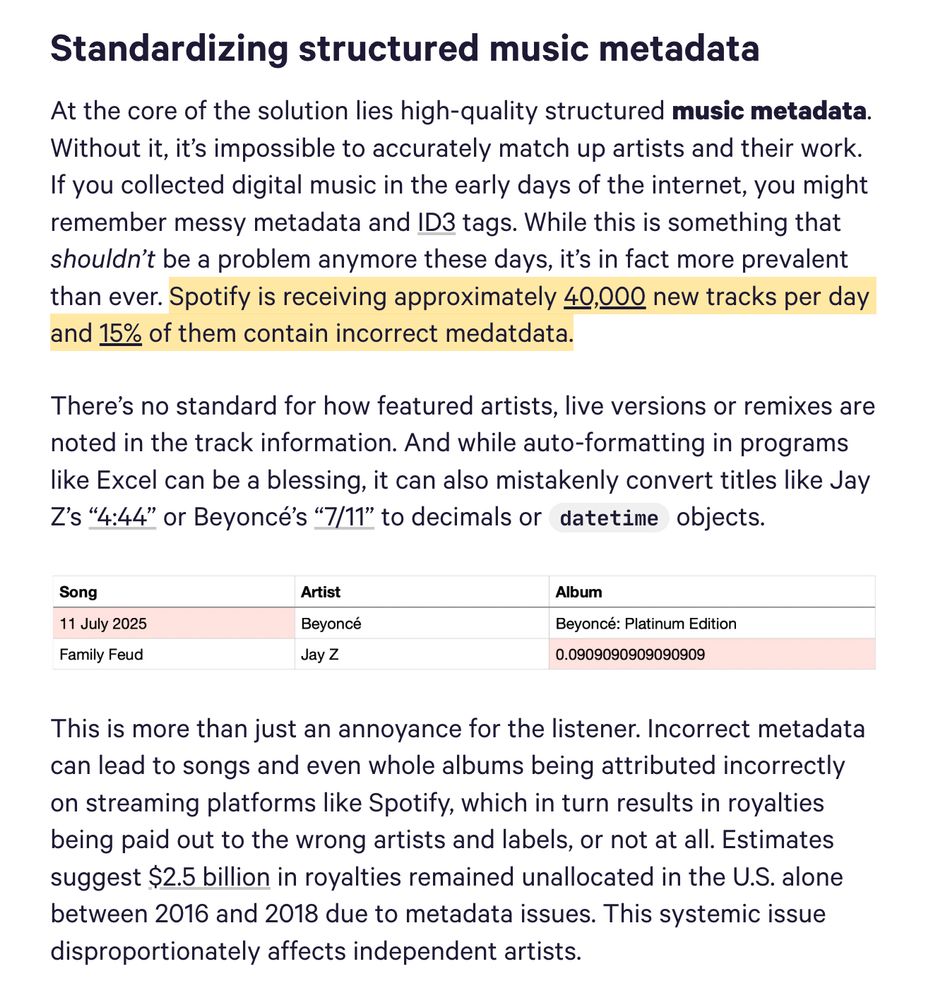
TIL: Incorrect music metadata is a huge problem and is causing artists to lose millions in royalties. This disproportionaly affects independent musicians. But structured NLP can help!
explosion.ai/blog/love-wi...
explosion.ai/blog/love-wi...
March 25, 2025 at 12:55 PM
TIL: Incorrect music metadata is a huge problem and is causing artists to lose millions in royalties. This disproportionaly affects independent musicians. But structured NLP can help!
explosion.ai/blog/love-wi...
explosion.ai/blog/love-wi...
I'm a @datavizsociety.bsky.social mentor this round, and it's inspiring all sorts of musings. Check it out!
open.substack.com/pub/itselisa...
open.substack.com/pub/itselisa...

March 20, 2025 at 3:42 PM
I'm a @datavizsociety.bsky.social mentor this round, and it's inspiring all sorts of musings. Check it out!
open.substack.com/pub/itselisa...
open.substack.com/pub/itselisa...
Reposted by Elisa Davis

Thanks for the shoutout Elisa~ it was a really fun chat! And to anyone else who wanna chat about their #IronViz, just hit me up and we’ll make it happen 😉
March 18, 2025 at 11:37 PM
Thanks for the shoutout Elisa~ it was a really fun chat! And to anyone else who wanna chat about their #IronViz, just hit me up and we’ll make it happen 😉
191 people entered Iron Viz this year. I wasn’t a finalist, but I’ve still had multiple speaking opportunities because of my submission. The competition might be over, but the real value starts after you hit submit. Read more on my Substack!

March 18, 2025 at 7:53 PM
191 people entered Iron Viz this year. I wasn’t a finalist, but I’ve still had multiple speaking opportunities because of my submission. The competition might be over, but the real value starts after you hit submit. Read more on my Substack!
I will be passing on this trend, as I couldn't even keep sourdough starter alive last time DIY food raising seemed like a good idea.

U.S. Ag Secretary Rollins said on TV that Americans upset with high egg prices could raise chickens in their backyards: “The silver lining in all of this is how do all of us solve something like this? People are looking around and saying, ‘How can I get a chicken in my back yard?’ It’s awesome!”
March 4, 2025 at 6:57 PM
I will be passing on this trend, as I couldn't even keep sourdough starter alive last time DIY food raising seemed like a good idea.
Reposted by Elisa Davis

Help me write a playbook of best practices for giving data-specific technical workshops or code-heavy talks. This isn't about bashing bad talks, it's about sharing experiences from which we can all learn. We'll all need slightly different things from a learning environment, so let's share. #databs
Have you ever attended a super great OR super terrible data + coding workshop (probably Python, R, shiny, js, etc)? What made it terrible or amazing?
March 4, 2025 at 7:23 AM
Help me write a playbook of best practices for giving data-specific technical workshops or code-heavy talks. This isn't about bashing bad talks, it's about sharing experiences from which we can all learn. We'll all need slightly different things from a learning environment, so let's share. #databs
Reposted by Elisa Davis


March 4, 2025 at 2:26 PM
Reposted by Elisa Davis

Hey #XPNfam, ever wonder what new music @wxpnfm.bsky.social might play in the near future? Well, you can see if @somevelvetblog.bsky.social listens to new album releases in his Album-A-Day music diary before they air on #WXPN. Explore by year or month on #Tableau
public.tableau.com/app/profile/...
public.tableau.com/app/profile/...

January 26, 2025 at 4:42 PM
Hey #XPNfam, ever wonder what new music @wxpnfm.bsky.social might play in the near future? Well, you can see if @somevelvetblog.bsky.social listens to new album releases in his Album-A-Day music diary before they air on #WXPN. Explore by year or month on #Tableau
public.tableau.com/app/profile/...
public.tableau.com/app/profile/...
Reposted by Elisa Davis

The Perfect Movie Screen…

January 24, 2025 at 10:49 AM
The Perfect Movie Screen…

Reposted by Elisa Davis

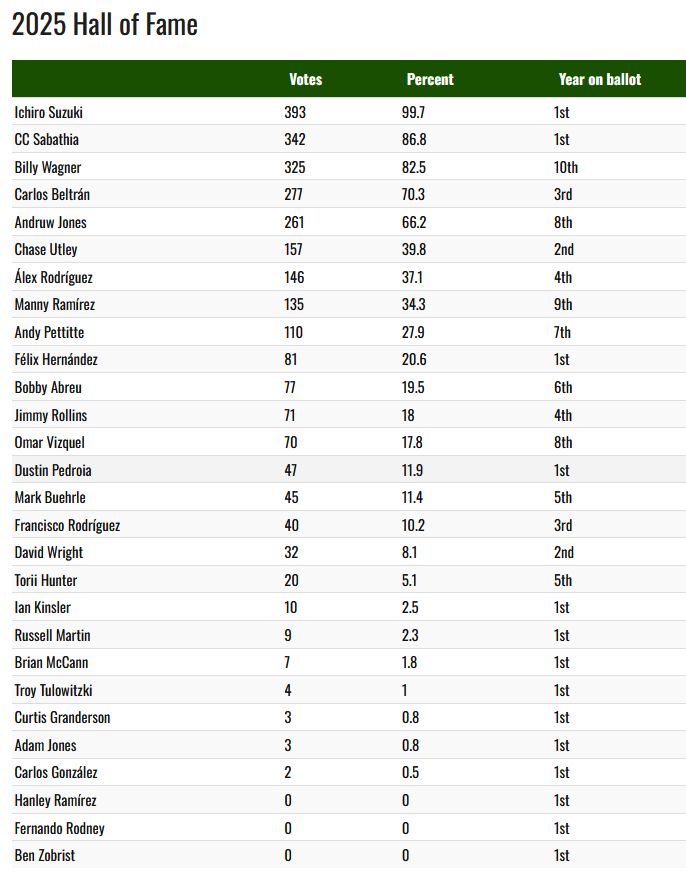
Full voting results per the BBWAA:
January 21, 2025 at 11:22 PM
Full voting results per the BBWAA:
Reposted by Elisa Davis

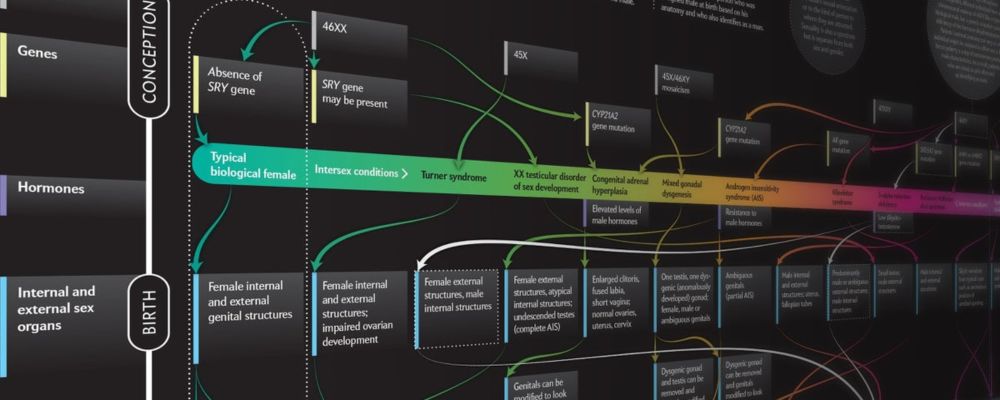
If anyone happens to need it this week for...reasons...this is the best graphic on the complexity of human sex determination I've ever seen. I use it in an undergrad course on gene regulatory mechanisms. Shoutout to @unamandita.bsky.social!
www.scientificamerican.com/article/beyo...
www.scientificamerican.com/article/beyo...
Beyond XX and XY: The Extraordinary Complexity of Sex Determination
A host of factors figure into whether someone is female, male or somewhere in between
www.scientificamerican.com
January 21, 2025 at 8:58 PM
If anyone happens to need it this week for...reasons...this is the best graphic on the complexity of human sex determination I've ever seen. I use it in an undergrad course on gene regulatory mechanisms. Shoutout to @unamandita.bsky.social!
www.scientificamerican.com/article/beyo...
www.scientificamerican.com/article/beyo...
Reposted by Elisa Davis

I’m seeing some new folks on this here platform complaining about a lack of engagement & interaction.
Here’s the thing: Without an algorithm shoveling things at you (thank the gods), interaction *is* different and something you have to, well, actively generate.
Here’s what I find works:
Here’s the thing: Without an algorithm shoveling things at you (thank the gods), interaction *is* different and something you have to, well, actively generate.
Here’s what I find works:
January 19, 2025 at 2:15 PM
I’m seeing some new folks on this here platform complaining about a lack of engagement & interaction.
Here’s the thing: Without an algorithm shoveling things at you (thank the gods), interaction *is* different and something you have to, well, actively generate.
Here’s what I find works:
Here’s the thing: Without an algorithm shoveling things at you (thank the gods), interaction *is* different and something you have to, well, actively generate.
Here’s what I find works:
Reposted by Elisa Davis

lmao no, TikTok users are not moving to Bluesky. They would literally rather learn Mandarin than learn how to read a feed of text posts. This is a millennial retirement home.
January 19, 2025 at 5:45 AM
lmao no, TikTok users are not moving to Bluesky. They would literally rather learn Mandarin than learn how to read a feed of text posts. This is a millennial retirement home.
Reposted by Elisa Davis

It’s Friday night. Turn off the news this weekend. Avoid politics. Have dinner with friends and family. Play board games. Go for a nice walk. Watch a romcom. Eat food that’s bad for you and terribly delicious. Ban nonsense from your weekend. Friendly advice. 💜
January 18, 2025 at 12:28 AM
It’s Friday night. Turn off the news this weekend. Avoid politics. Have dinner with friends and family. Play board games. Go for a nice walk. Watch a romcom. Eat food that’s bad for you and terribly delicious. Ban nonsense from your weekend. Friendly advice. 💜
Reposted by Elisa Davis

Latest TUG is youtu.be/XomcdKCboi0
Nir Smilga presents The Beatles - Song Writers per Album
@itselisadavis.bsky.social "Chappell Roan" viz highlights the career of an amazing pop artist
Ojoswi Basu - Community Spotlight Author
LOTS of awesome content @ youtube.com/@TeamDataFam #datafam
Nir Smilga presents The Beatles - Song Writers per Album
@itselisadavis.bsky.social "Chappell Roan" viz highlights the career of an amazing pop artist
Ojoswi Basu - Community Spotlight Author
LOTS of awesome content @ youtube.com/@TeamDataFam #datafam

January 18, 2025 at 9:40 AM
Latest TUG is youtu.be/XomcdKCboi0
Nir Smilga presents The Beatles - Song Writers per Album
@itselisadavis.bsky.social "Chappell Roan" viz highlights the career of an amazing pop artist
Ojoswi Basu - Community Spotlight Author
LOTS of awesome content @ youtube.com/@TeamDataFam #datafam
Nir Smilga presents The Beatles - Song Writers per Album
@itselisadavis.bsky.social "Chappell Roan" viz highlights the career of an amazing pop artist
Ojoswi Basu - Community Spotlight Author
LOTS of awesome content @ youtube.com/@TeamDataFam #datafam
Reposted by Elisa Davis

#TodayinHistory #dataviz #Onthisday #OTD 📊
💀 Jan 15, 1994 Roger M. Goldwyn died
1971: development of the radial star plot to represent multivariate data (vertices at equally spaced intervals, distance from center ~ value of a variable)
[But first invented by Georg von Mayr, 1877]
💀 Jan 15, 1994 Roger M. Goldwyn died
1971: development of the radial star plot to represent multivariate data (vertices at equally spaced intervals, distance from center ~ value of a variable)
[But first invented by Georg von Mayr, 1877]

January 16, 2025 at 2:13 AM
#TodayinHistory #dataviz #Onthisday #OTD 📊
💀 Jan 15, 1994 Roger M. Goldwyn died
1971: development of the radial star plot to represent multivariate data (vertices at equally spaced intervals, distance from center ~ value of a variable)
[But first invented by Georg von Mayr, 1877]
💀 Jan 15, 1994 Roger M. Goldwyn died
1971: development of the radial star plot to represent multivariate data (vertices at equally spaced intervals, distance from center ~ value of a variable)
[But first invented by Georg von Mayr, 1877]
If you missed it, I talked about design, inspiration and wireframing of my Chappell Roan themed Iron Viz entry at the Tableau Public TUG. (~min 11) Enjoy!
youtu.be/3PSj3Ym5FMA
youtu.be/3PSj3Ym5FMA

PublicTUG January Meeting 2025
YouTube video by Tableau PublicTUG
youtu.be
January 17, 2025 at 5:25 AM
If you missed it, I talked about design, inspiration and wireframing of my Chappell Roan themed Iron Viz entry at the Tableau Public TUG. (~min 11) Enjoy!
youtu.be/3PSj3Ym5FMA
youtu.be/3PSj3Ym5FMA
Reposted by Elisa Davis


Reposted by Elisa Davis

bot that puts 3 verbs in a row in a live laugh love font but it chooses from any verb
January 16, 2025 at 1:46 AM
bot that puts 3 verbs in a row in a live laugh love font but it chooses from any verb
Reposted by Elisa Davis

📊 Get productive in our next free coworking event on Jan 28 at 12 pm GMT. Work on your #dataviz project, meet like-minded individuals, and hold each other accountable in a supportive environment. Sign up: https://buff.ly/41TDSxZ

January 16, 2025 at 6:30 PM
📊 Get productive in our next free coworking event on Jan 28 at 12 pm GMT. Work on your #dataviz project, meet like-minded individuals, and hold each other accountable in a supportive environment. Sign up: https://buff.ly/41TDSxZ