📈Learn To Read F1 Telemetry Data
⚙️ Performance Engineer, PhD in Motorcycle Dynamics
Unlock extra content: buymeacoffee.com/f1dataanalysis
Places to find me: linktr.ee/fdataanalysis
Red Bull ran the least drag, Sauber the most
McL was quickest through excellent aero efficiency (low drag with high downforce)
What's your prediction for the race?

Red Bull ran the least drag, Sauber the most
McL was quickest through excellent aero efficiency (low drag with high downforce)
What's your prediction for the race?
Underpowered engine, poor low-speed performance… they’ve only scored points at four tracks so far (mainly those demanding high aero efficiency: Bahrain, Catalunya, Silverstone, Spa).
Underpowered engine, poor low-speed performance… they’ve only scored points at four tracks so far (mainly those demanding high aero efficiency: Bahrain, Catalunya, Silverstone, Spa).
P = m*v*a + 0.5*CxA*ρ^v^3
So:
P = (m*a+k*v2)*v
P = m*v*a + k^v^3
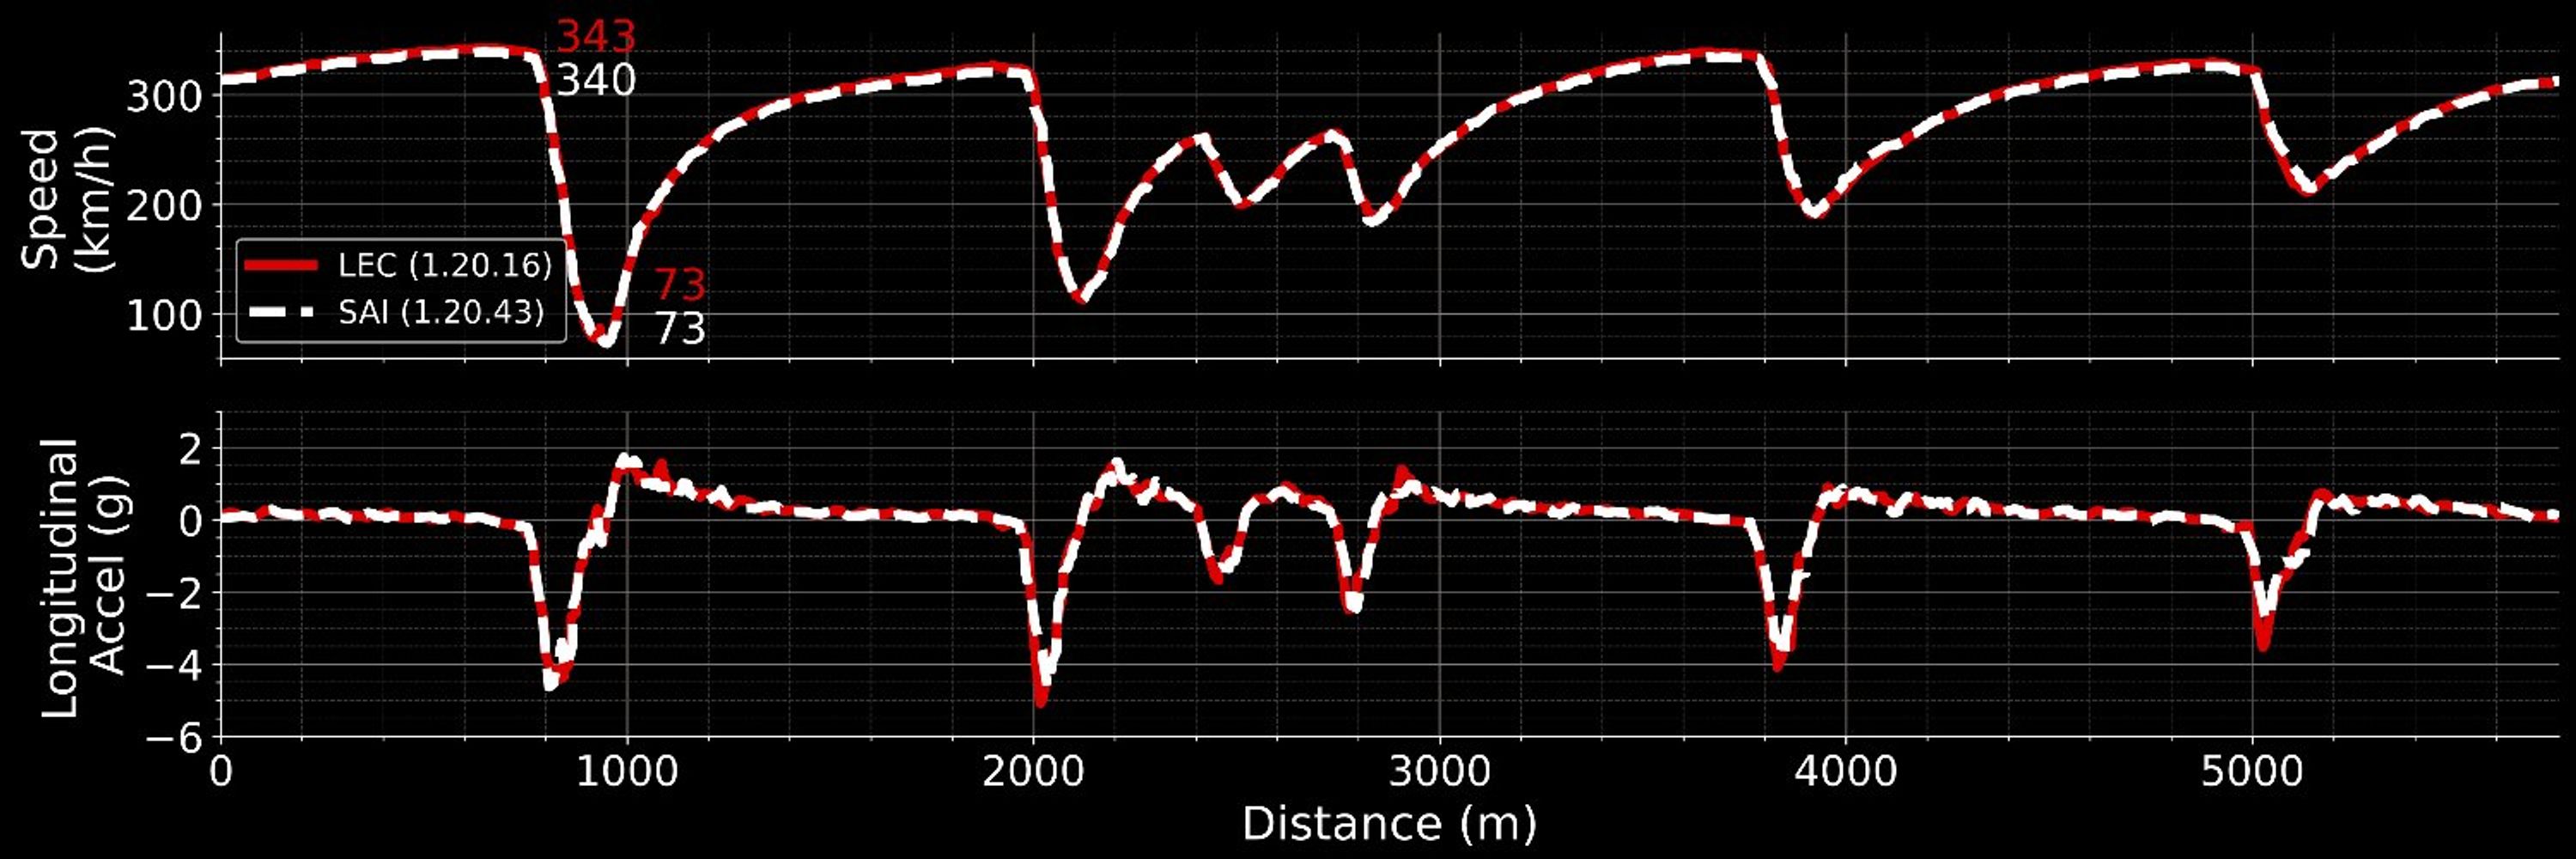
Engine power P and car mass m don’t change with DRS
I estimated k twice: first using instants without DRS, then with DRS (in quali→no tow)

P = m*v*a + 0.5*CxA*ρ^v^3
So:
P = (m*a+k*v2)*v
P = m*v*a + k^v^3
Engine power P and car mass m don’t change with DRS
I estimated k twice: first using instants without DRS, then with DRS (in quali→no tow)
🔵RBR 29.3%✅
🟢Merc 26.7%
🔴Ferrari 21.9%❌
🟠McL 21.5%❌
McL’s deficit makes it harder for its drivers to battle on track, which favours VER
Read on 👇
🔵RBR 29.3%✅
🟢Merc 26.7%
🔴Ferrari 21.9%❌
🟠McL 21.5%❌
McL’s deficit makes it harder for its drivers to battle on track, which favours VER
Read on 👇

PIA's was indeed slower than NOR, but his potential pace was way closer than it looked like 😉

PIA's was indeed slower than NOR, but his potential pace was way closer than it looked like 😉
1)NOR quickest
2)VER +0.30s/lap
3)LEC +0.38
Soft-Medium-Soft
1)PIA +0.15s/lap vs NOR
2-3)BEA/HAM +0.19
4)ANT +0.23
5)RUS +0.30
1)NOR quickest
2)VER +0.30s/lap
3)LEC +0.38
Soft-Medium-Soft
1)PIA +0.15s/lap vs NOR
2-3)BEA/HAM +0.19
4)ANT +0.23
5)RUS +0.30

