Information is Beautiful
@infobeautiful.bsky.social
6.9K followers 35 following 850 posts
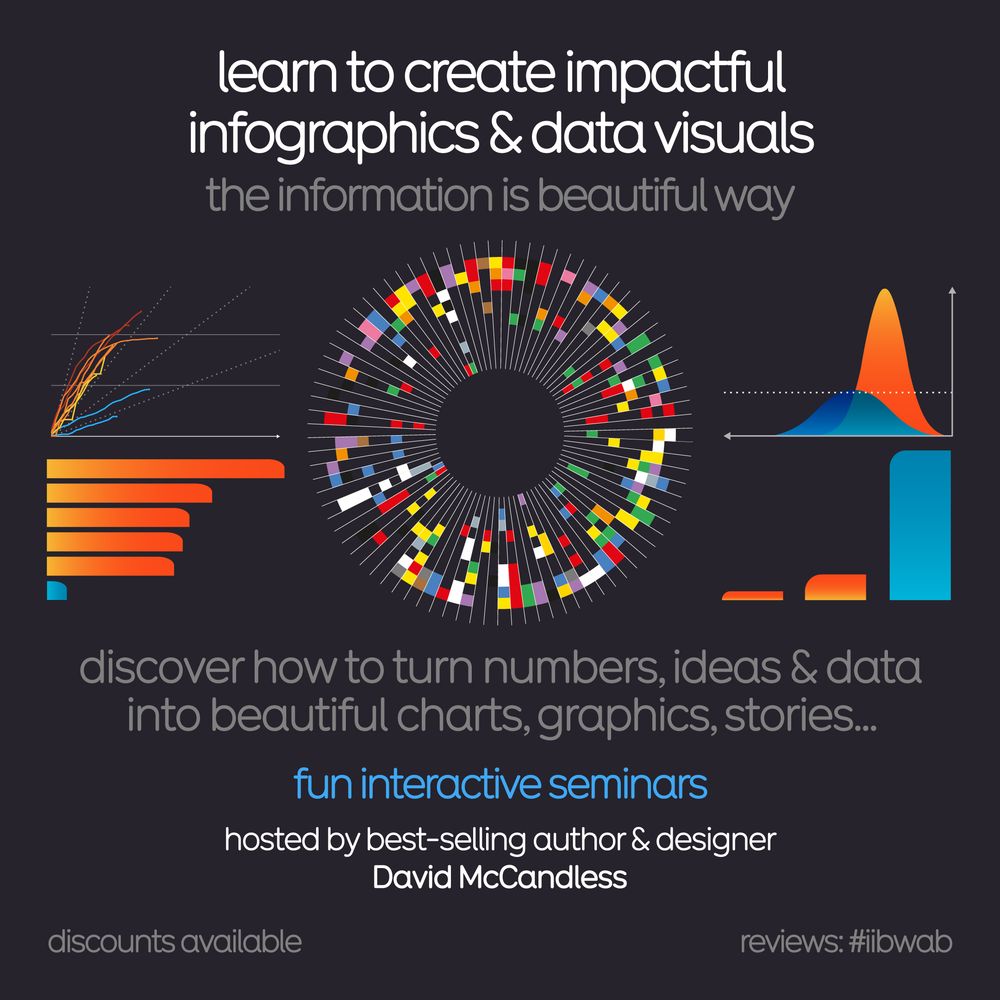
Data visualizations & information graphics by David McCandless. Plus favourite finds & graphics from around the web. Making sense of the world - well, trying to - since 2009. https://linktr.ee/infobeautiful
Posts Media Videos Starter Packs
infobeautiful.bsky.social
Explained: Biodegradable vs Compostable vs Non-Biodegradable plastics ♻️
Part of our larger plastics #infographic
informationisbeautiful.net/visualizatio...
Infographics conveys key information about biodegradable plastics which must completely disintegrate via natural biological processes. But most 'biodegradable' plastics only breaks down completely in industrial units. With 50% of plastics currently dumped in the environment, this means many plastics end up polluting nature as microplastics. An infographic explain compostable plastics which must completely disintegrated under composting conditions leaving no toxic materials. Plastics may be biodegradable but not compostable via the two composting routes: home (in a compost bin) or industrial (in special units) An infographic explains non-biodegradable plastics, noting that none of the six major plastic types are biodegradable. This mean many plastics rot, melt and fragment in the environment forming microplastics which pollute oceans and soils, while leaking harmful chemicals like phthalates and bisphenols.
infobeautiful.bsky.social
Making Data into Art - a microfilm we made with Microsoft a few years back, starring Information is Beautiful founder, David McCandless.

Learn more about our process & work & beautiful things 🌼
bit.ly/IIBWAB
geni.us/IIBLive
#iibwab
infobeautiful.bsky.social
Which language is most difficult to learn?

via The Economist
www.economist.com/graphic-detail
Simple grouped word cloud shows language learning durations for various languages. Grouped by weeks: 24-30 weeks for European languages like French and Spanish; 36 weeks for languages like German and Indonesian; 44 weeks for a diverse group including Russian and Hindi; 88 weeks for Arabic, Chinese, Japanese, and Korean.
infobeautiful.bsky.social
One for brits: A southern's view of the UK and Ireland

From the Terrible Maps book by Michael Howe www.amazon.co.uk/Terrible-Map...
A humorous map titled 'A Southerner’s view of the UK and Ireland,' depicting stereotypical perceptions of different regions. Scotland is labeled with 'Whisky,' 'Fried Mars bars,' and 'Golf.' Northern England features 'The Beatles' and 'Footballers live here.' Ireland is marked with 'Guinness' and 'George Best.' Southern England is divided into areas such as 'Oxford,' 'Farmers,' 'Fake tan,' and 'Retired people.' Wales is labeled 'Dragons... and anxious sheep.' The North/South divide is also marked, with a playful tone throughout.
infobeautiful.bsky.social
The entire observable universe in one image.

Artist's impression, we think. Not to any obvious scale.

Art print by Pablo Carlos Budassi fineartamerica.com/featured/obs...
A circular diagram representing the observable universe, with Earth at the center. The diagram depicts various celestial objects and structures arranged concentrically, including planets, stars, galaxies, galaxy clusters, and superclusters. Labels are visible throughout the diagram, identifying specific objects and features. The outermost edge of the circle is labeled "furthest visible galaxies" and "big bang," signifying the limit of the observable universe.
infobeautiful.bsky.social
How to keep track of all the emerging AI LLMs like Claude, Gemini, ChatGPT? Check our interactive tracker
geni.us/IIB-LLMs

made with @vizsweet
Chart titled "Major Large Language Models (LLMs)" showcasing various models ranked by capabilities and sized by training parameters. Models are depicted as colored circles representing different organizations, such as Anthropic, Google, Meta, OpenAI, and others. Capabilities are measured on the y-axis (MMLU score) and parameters on the x-axis. Notable models include GPT-4 Classic, Claude 3, and DeepSeek V3.1, among others. A line marks 70+ MMLU as ideal. Image created by David McCandless, Tom Evans, and Paul Barton, dated September 2025.
infobeautiful.bsky.social
The expressive speed vs information 'bit rate' of spoken languages.
French and Vietnamese have the highest information density.

via The Economist
www.economist.com/graphic-detail
Stacked area chart comparing syllable rate and information rate across 14 languages. Two columns show distribution curves for syllables per second (4-8) and information rate in bits per second (30-60). Japanese has highest syllable rate, while Vietnamese conveys information fastest. Languages vary in speech speed vs information density.
infobeautiful.bsky.social
Which countries have the most cat owners?
Maybe not what you expect
Bar chart showing cat ownership percentages in various countries as of 2017. Russia leads with 59%, followed by the US (43%) and Argentina (41%). European countries like Italy, France, and UK range from 32-40%. Asian countries generally have lower rates, with South Korea lowest at 9%. Data covers 15 countries, with a cat icon in the corner.
infobeautiful.bsky.social
Human Attachment systems meets Maslow's Hierarchy of Needs. Each stage has a corresponding attachment figure. Interesting.

by @heidipsychology
www.instagram.com/p/C7b9cYusp6H/
A hand-drawn illustration of an "Attachment System Hierarchy of Needs" based on Maslow's Hierarchy. The image depicts a pyramid divided into six horizontal sections, each representing a different level of need. The levels, from bottom to top, are: Physiological Needs (Regulator), Physical & Interpersonal Safety (Protector), Intimate Relationships, Family Formation, Friends (Comforter), Self-Awareness and Sense of Agency (Guide), and Achieving One's Full Potential (Partner). The top of the pyramid is labeled "Self-Actualization" (Attachment Figure). The pyramid is further categorized into Basic Needs, Psychological Needs, and Self-Fulfillment Needs on the right side. The illustration is attributed to Crittenden, Spieker, Landini, and Grey (2021) and is related to the use of parental attachment in family court proceedings.
infobeautiful.bsky.social
Beautiful vintage #infographic on the ceiling & speed of different aircraft
(via Reddit bit.ly/4c2bMCs)
Vintage infographic titled "Service ceiling (ft)" plots the service ceiling (maximum altitude) of various aircraft against their maximum speed in miles per hour. The data spans from 1916 to 1963, covering biplanes, monoplanes, and jet aircraft. The trend shows a steady increase in both speed and altitude over time as aviation technology advanced.
infobeautiful.bsky.social
It's fun to learn how to create impactful #infographics & data-visuals like this.

2 x virtual half days:
15th & 16th Oct 🇺🇸 USA timezone
11th & 12th Nov 🇬🇧 UK/EU/AUS

In-person Mon 13th Oct London 🇬🇧

Details geni.us/WAB2024
Reviews geni.us/WABreviews
A playful scatterplot (using dog silhouettes instead of dots) depicts the best dog, according to data. On the vertical axis is a measure of public popularity. On the horizontal is an indexed score of several metrics to consider when owning a dog (cost, temperament, no. of genetic ailments etc). Each dog is coloured by category (sport, toy, hound etc) and sized (S, M, L). If a dog is facing left, it's kind of a dumb dog. If it's facing right, it's an intelligent dog.
infobeautiful.bsky.social
JUST RELEASED: Highly discounted workshop seats for those in lower-income countries.

Next dates:
15th & 16th Oct 🇺🇸 USA timezone
11th & 12th Nov 🇬🇧 UK/EU/AUS

Qualifying countries bit.ly/LowerIncome
Deets bit.ly/IIBWAB
Say hi to apply!
informationisbeautiful.net/contact
Discounted workshop places available for individuals from lower-income countries. Includes contact information and vibrant data visualization graphics. #iibwab
infobeautiful.bsky.social
Tech that was predicted vs Tech that was not.
Interesting list by Kevin Kelly
kk.org/thetechnium/...
A list titled "The Unexpected" and "The Expected" categorizes inventions and discoveries. The "Unexpected" list includes: X-rays, nuclear energy, radio, TV, electronics, photography, sound recording, quantum mechanics, relativity, transistors, masers; lasers, superconductors; superfluids, atomic clocks; Mössbauer effect, determining composition of celestial bodies, dating the past (Carbon 14, etc.), detecting invisible planets, the ionosphere, 1  and van Allen Belts. The "Expected" list includes automobiles, flying machines, steam engines, submarines, spaceships, telephones, robots, death rays, transmutation, artificial life, immortality, invisibility, levitation, teleportation, communication with dead, observing the past, the future, 2  and telepathy.
infobeautiful.bsky.social
Periodic table by lickability :)

(by Reddit user: u/Wellihol)

Note: this chart is in some cases possibly dangerously inaccurate. e.g. Elemental Calcium can cause fire in the presence of water. So, for any elemental licking experiments, take with a pinch of Na Cl
The image is a playful reinterpretation of the periodic table of elements titled "Can I Lick It?" Instead of categorizing chemical elements, this version appears to classify various substances based on whether they are safe to lick. The design mimics the structured layout of a traditional periodic table, lending a scientific aesthetic to the humorous concept. Below the title, an explanatory text likely provides context for the classification system. The display includes four circular elements, possibly representing different materials or examples relevant to the theme. The combination of scientific visuals and an amusing premise creates an engaging and informative piece. It's not accurate in terms of safety, so don't do this at home.
infobeautiful.bsky.social
Places the French government recommends you should not go

(by Reddit user: u/Winter-Leadership986)
A world map highlighting in red the areas where the French government advises against all travel. The red-marked regions include large parts of Russia, the Sahel region in Africa, parts of the Middle East such as Syria, Iraq, and Afghanistan, as well as areas in Central and South America, including parts of Colombia and Venezuela. Several countries in East Africa, including Somalia and South Sudan, are also highlighted, along with parts of Southeast Asia, including Myanmar and the southern Philippines. The rest of the world remains in white.
infobeautiful.bsky.social
Chat GPT & Google's Gemini are neck and neck in the AI LLM's race for greater, "more human" artificial intelligence - according to industry benchmarks.

graphic made with @vizsweet
Scatter plot showing rankings of major LLMs based on LMArena and SWE-Bench scores. Models are color-coded by developer: anthropic, chinese, google, meta, mistral, openAI, and xAI. The x-axis represents SWE-Bench score, y-axis is LMArena score. Higher-ranked models include Gemini 2.5 Pro, GPT-5, and Grok 4, positioned in the upper-right quadrant, indicating high scores on both axes. Llama 3 70B is in the bottom-right quadrant, showing a lower LMArena score but a higher SWE-Bench score.
infobeautiful.bsky.social
The East / West divide in Germany is still - sometimes painfully - clear

(by Instagram user: @discover_our_planet_ )
infobeautiful.bsky.social
Join @infobeautiful founder David McCandless for a rare in-person training in LDN 🇬🇧 and learn his concept-driven approach to data-visualisation:

Mon 13th Oct London 🇬🇧

Deets: bit.ly/IIBWAB
Reviews: geni.us/WABreviews
An infographic flyer advertising an online seminar for learning how to create impactful infographics and data visuals with best-selling author and data-visualisation practitioner David McCandless of Information is Beautiful. Discounts are available. A photo of author and founder of Information is Beautiful, David McCandless, presenting a training in front of a large screen to a seated audience
infobeautiful.bsky.social
The New York Times' classic #dataviz made in *Flash* are back online - thanks to some kind of tech magic. Via @flowingdata
flowingdata.com/2024/01/10/n...
Screenshot of a classic Flash datavisualisation by the New York Times showing the box office receipts of movies from 1986 to 2008
infobeautiful.bsky.social
Great films fact-checked and visualised scene by scene. Is there really such a thing as a “true” true story in Hollywood? informationisbeautiful.net/visualizatio...
A selection of true story Hollywood films is presented with diagrams. Each diagram is a horizontal bar with vertical stripes inside. The stripes represent a scene-by-scene breakdown of the film. The colors of the stripes indicate whether a scene is true, true-ish, false-ish, false or whether that is unknow. For example the Film Selma is shown as 100% true, while the film The Imitation Game is shown as only 42.3% true.
infobeautiful.bsky.social
Learn how to create impactful data-visualizations & infographics. Join our highly-rated online seminars

2 x virtual half days:
15th & 16th Oct 🇺🇸 USA timezone
11th & 12th Nov 🇬🇧 UK/EU/AUS

In-person Mon 13th Oct London 🇬🇧

Deets: geni.us/WAB2024
Reviews: geni.us/WABreviews
An infographic flyer advertising an online seminar for learning how to create impactful infographics and data visuals with best-selling author and data-visualisation practitioner David McCandless of Information is Beautiful. Discounts are available.
infobeautiful.bsky.social
Some good USA deals on our beautiful books out there
📘 58% off Beautiful News - geni.us/BNEWS
📕 21% off Knowledge is Beautiful (hardcover) - geni.us/KIB25
📗 42% off The Visual Miscellaneum - geni.us/VMisc25
bit.ly/IIB-Books
The cover images of three infographic books by David McCandless: Beautiful News, Knowledge is Beautiful and The Visual Miscellaneum