


Josh Persi
@joshpersi.bsky.social
Data scientist and serial hobbyist 🏋️👨🍳🪴
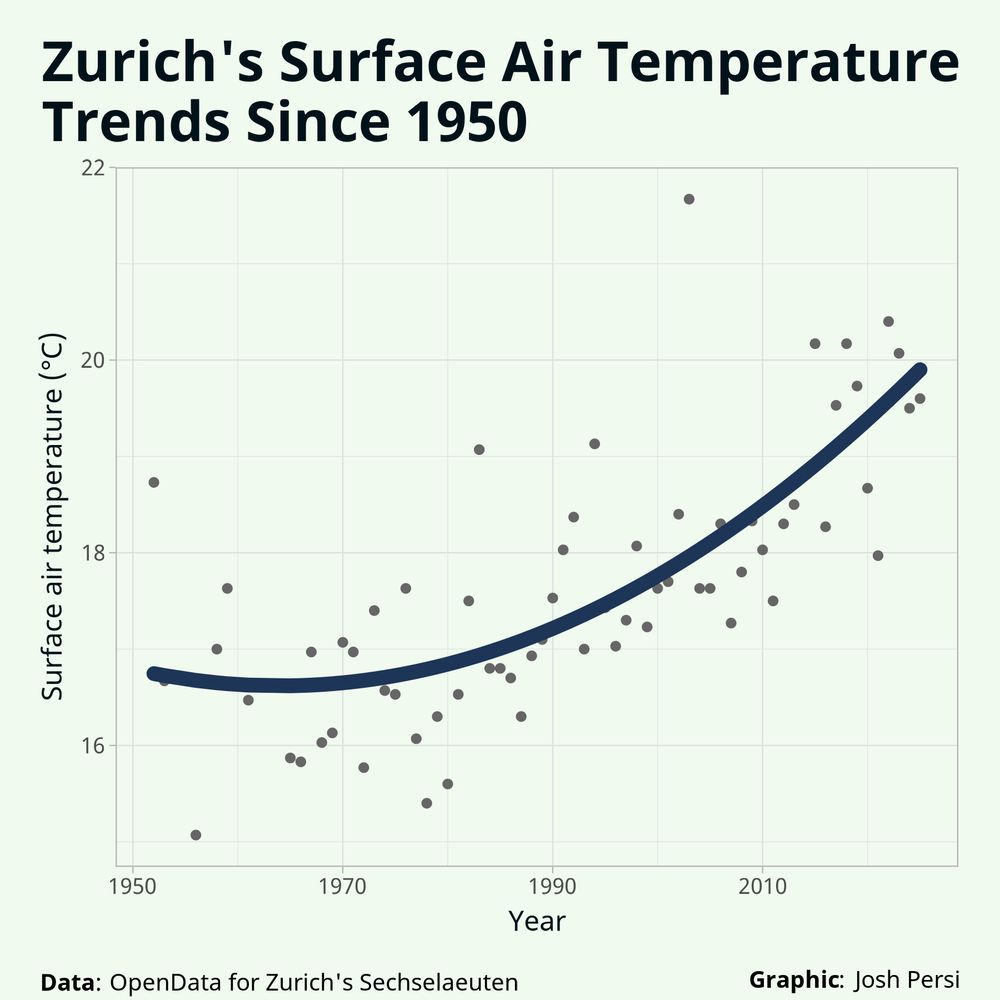
I took this week's #TidyTuesday as an opportunity to try and brush up on modelling and learn tidymodels.org. I have no great modelling insights to share, but in making this graph, I did learn you can set line-ends to be round in geom_line(). Who knew?!
#DataViz #RStats #ggplot2
#DataViz #RStats #ggplot2
December 5, 2025 at 1:12 AM
I took this week's #TidyTuesday as an opportunity to try and brush up on modelling and learn tidymodels.org. I have no great modelling insights to share, but in making this graph, I did learn you can set line-ends to be round in geom_line(). Who knew?!
#DataViz #RStats #ggplot2
#DataViz #RStats #ggplot2
Reposted by Josh Persi

testthat 3.3.0 is here! Major updates for #RStats testing include failure messages for easier debugging, 6 new specific expectations, and the SlowReporter to find your bottlenecks.
Heads Up: R 4.1+ is now required, and old mocking functions are removed.
Read the post: tidyverse.org/blog/2025/11...
Heads Up: R 4.1+ is now required, and old mocking functions are removed.
Read the post: tidyverse.org/blog/2025/11...

November 24, 2025 at 3:34 PM
testthat 3.3.0 is here! Major updates for #RStats testing include failure messages for easier debugging, 6 new specific expectations, and the SlowReporter to find your bottlenecks.
Heads Up: R 4.1+ is now required, and old mocking functions are removed.
Read the post: tidyverse.org/blog/2025/11...
Heads Up: R 4.1+ is now required, and old mocking functions are removed.
Read the post: tidyverse.org/blog/2025/11...
The Data Science Learning Community is starting a new book club cohort for DuckDB in Action this Wednesday. Come read and learn with us! All are welcome!
DSLC: dslc.io
DuckDB in Action: motherduck.com/duckdb-book-...
#RStats #python #DataScience #OpenSource
DSLC: dslc.io
DuckDB in Action: motherduck.com/duckdb-book-...
#RStats #python #DataScience #OpenSource

Free "DuckDB in Action" Book
Download a free PDF of the DuckDB in Action book published by Manning. The book is rich with technical guidance on data analytics and data engineering with DuckDB and MotherDuck.
motherduck.com
November 24, 2025 at 3:33 AM
The Data Science Learning Community is starting a new book club cohort for DuckDB in Action this Wednesday. Come read and learn with us! All are welcome!
DSLC: dslc.io
DuckDB in Action: motherduck.com/duckdb-book-...
#RStats #python #DataScience #OpenSource
DSLC: dslc.io
DuckDB in Action: motherduck.com/duckdb-book-...
#RStats #python #DataScience #OpenSource
A very long time in the making but I'm eager to share I've made a Quarto blog to talk about all the data science stuff I'm learning! First post is about adding data source and author attributions in ggplot2! Feel free to stop by!
joshpersi.github.io/blog
#RStats #Quarto #DataScience #OpenSource
joshpersi.github.io/blog
#RStats #Quarto #DataScience #OpenSource
Controlling source and author attributions in your {ggplot2} graphics – Josh Persi
joshpersi.github.io
November 22, 2025 at 3:17 PM
A very long time in the making but I'm eager to share I've made a Quarto blog to talk about all the data science stuff I'm learning! First post is about adding data source and author attributions in ggplot2! Feel free to stop by!
joshpersi.github.io/blog
#RStats #Quarto #DataScience #OpenSource
joshpersi.github.io/blog
#RStats #Quarto #DataScience #OpenSource
This is my first time joining in on the #TidyTuesday fun. Looking forward to seeing what everyone else is doing with this week's data!
#DataViz #RStats #ggplot2
#DataViz #RStats #ggplot2

November 14, 2025 at 5:22 AM
This is my first time joining in on the #TidyTuesday fun. Looking forward to seeing what everyone else is doing with this week's data!
#DataViz #RStats #ggplot2
#DataViz #RStats #ggplot2
10 minutes is all we were allowed for day 13 of the #30DayMapChallenge. This took me about 15 minutes, so I'm a little over, but this was a fun way to work under a time constraint and avoid endless tweaking!
#DataViz #RStats #ggplot2
#DataViz #RStats #ggplot2

November 14, 2025 at 3:44 AM
10 minutes is all we were allowed for day 13 of the #30DayMapChallenge. This took me about 15 minutes, so I'm a little over, but this was a fun way to work under a time constraint and avoid endless tweaking!
#DataViz #RStats #ggplot2
#DataViz #RStats #ggplot2
Day 11 is all about minimalism so I made a map with four lines! Perhaps too minimal, but I also couldn't find geographic data on the stations themselves, so maybe it was meant to be 🤷
#30DayMapChallenge #DataViz #RStats #ggplot2
#30DayMapChallenge #DataViz #RStats #ggplot2

November 12, 2025 at 12:11 AM
Day 11 is all about minimalism so I made a map with four lines! Perhaps too minimal, but I also couldn't find geographic data on the stations themselves, so maybe it was meant to be 🤷
#30DayMapChallenge #DataViz #RStats #ggplot2
#30DayMapChallenge #DataViz #RStats #ggplot2
It's day 10 of the #30DayMapChallenge and the prompt is 'air', so I plotted global air temperature!
#DataViz #RStats #ggplot2
#DataViz #RStats #ggplot2

November 11, 2025 at 3:14 AM
It's day 10 of the #30DayMapChallenge and the prompt is 'air', so I plotted global air temperature!
#DataViz #RStats #ggplot2
#DataViz #RStats #ggplot2
Day 8 of the #30DayMapChallenge and I'm plotting a road network of Montréal!
#DataViz #RStats #ggplot2
#DataViz #RStats #ggplot2

November 8, 2025 at 2:48 PM
Day 8 of the #30DayMapChallenge and I'm plotting a road network of Montréal!
#DataViz #RStats #ggplot2
#DataViz #RStats #ggplot2
Reposted by Josh Persi

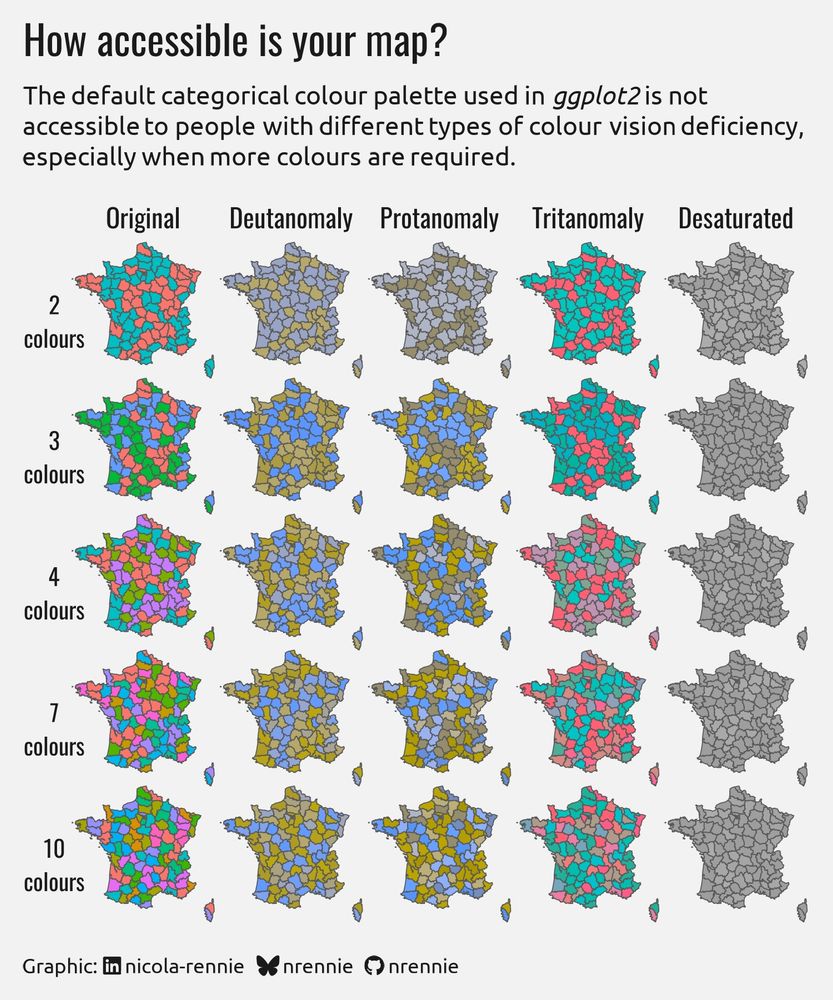
For the "accessibility" prompt on day 7 of the #30DayMapChallenge, I decided to investigate how accessible the default #ggplot2 colours are to people with different types of colour vision deficiency (and for different numbers of colours used). 🎨
#RStats #DataViz
#RStats #DataViz
November 7, 2025 at 5:39 PM
For the "accessibility" prompt on day 7 of the #30DayMapChallenge, I decided to investigate how accessible the default #ggplot2 colours are to people with different types of colour vision deficiency (and for different numbers of colours used). 🎨
#RStats #DataViz
#RStats #DataViz
I learned how little I know about accessibility with day 7 of the #30DayMapChallenge. I tried to use a legible font and added an alt-text, but my colors are low-contrast and I have no idea how far off of best practice I am. If you have resources on making maps accessible, please share them with me!

November 8, 2025 at 12:12 AM
I learned how little I know about accessibility with day 7 of the #30DayMapChallenge. I tried to use a legible font and added an alt-text, but my colors are low-contrast and I have no idea how far off of best practice I am. If you have resources on making maps accessible, please share them with me!
Day 6 of the #30DayMapChallenge makes things 3D! I took my elevation map from yesterday and made it so with the {rayshader} package.
#DataViz #RStats #ggplot2
#DataViz #RStats #ggplot2

November 7, 2025 at 1:08 AM
Day 6 of the #30DayMapChallenge makes things 3D! I took my elevation map from yesterday and made it so with the {rayshader} package.
#DataViz #RStats #ggplot2
#DataViz #RStats #ggplot2
The prompt for day 5 of the #30DayMapChallenge was 'Earth' so I tried to plot the elevation of the Kananaskis Valley!

November 6, 2025 at 4:19 AM
The prompt for day 5 of the #30DayMapChallenge was 'Earth' so I tried to plot the elevation of the Kananaskis Valley!
For Day 3 of the #30DayMapChallenge, I mapped the regions and departments of mainland France!
I learned a lot about {ggrepel} but couldn't quite get the labels to be on the outside of each region. Something to work on for next time!
I learned a lot about {ggrepel} but couldn't quite get the labels to be on the outside of each region. Something to work on for next time!

November 4, 2025 at 7:37 PM
For Day 3 of the #30DayMapChallenge, I mapped the regions and departments of mainland France!
I learned a lot about {ggrepel} but couldn't quite get the labels to be on the outside of each region. Something to work on for next time!
I learned a lot about {ggrepel} but couldn't quite get the labels to be on the outside of each region. Something to work on for next time!
Day 2 of the #30DayMapChallenge is all about lines.
Here's a single line that's near and dear to my heart — the Pacific Crest Trail!
Here's a single line that's near and dear to my heart — the Pacific Crest Trail!

November 4, 2025 at 3:52 AM
Day 2 of the #30DayMapChallenge is all about lines.
Here's a single line that's near and dear to my heart — the Pacific Crest Trail!
Here's a single line that's near and dear to my heart — the Pacific Crest Trail!
Already a couple days behind! Here's my contribution for the first day of the #30DayMapChallenge.
The HMS Terror and Erebus were abandoned during John Franklin's attempt to find the Northwest Passage.
#DataViz #RStats #ggplot2
The HMS Terror and Erebus were abandoned during John Franklin's attempt to find the Northwest Passage.
#DataViz #RStats #ggplot2

November 3, 2025 at 5:05 AM
Already a couple days behind! Here's my contribution for the first day of the #30DayMapChallenge.
The HMS Terror and Erebus were abandoned during John Franklin's attempt to find the Northwest Passage.
#DataViz #RStats #ggplot2
The HMS Terror and Erebus were abandoned during John Franklin's attempt to find the Northwest Passage.
#DataViz #RStats #ggplot2