Julian Hoffmann Anton
@julianhoffmann.bsky.social
940 followers 200 following 72 posts
Spatial Data Scientist • Artist • Economist | #ClimateRisk #Dataviz #Maps #DigitalArt #3D in London | X: Julian_H0ffmann Portfolio: https://www.julian-hoffmann-anton.com/
Posts Media Videos Starter Packs
Pinned
julianhoffmann.bsky.social
The Geology of the Moon | Lunalogy
A concept visualization highlighting a wide variety of geological features on our celestial neighbor. Created for the #30DayMapChallenge - Space and Time. Made in Blender, some #rstats, Illustrator & DaVinci Resolve. #GIS
julianhoffmann.bsky.social
3D map dream project alert!!
thomaskole.bsky.social
This has been in the making for a while, and it's coming soon:

An interactive 3D viewer for my virtual reconstruction of Tenochtitlan, right in your browser.

More details to follow. Stay tuned!

#tenochtitlan #blender #threejs
Reposted by Julian Hoffmann Anton
julianhoffmann.bsky.social
Downtown LA × Hollywood - Elevation visualization concept map. Experimental design. #b3d
Reposted by Julian Hoffmann Anton
julianhoffmann.bsky.social
London in 3D concept. #Day4 of sharing work-in-progress - Open access LiDAR DSM data, 50cm, 2017. #b3d
Reposted by Julian Hoffmann Anton
julianhoffmann.bsky.social
Jakarta in motion, design concept.
#Day3 of sharing work-in-progress. #3Dmap
Reposted by Julian Hoffmann Anton
julianhoffmann.bsky.social
Vessel Density Visualization (behind the scenes), #Day6 of sharing work-in-progress . Data from Emodnet December 2022⬇️. #b3d #gis
Reposted by Julian Hoffmann Anton
julianhoffmann.bsky.social
Orthographic City Design 0722 | Chicago OSM
#Day31 of sharing work-in-progress. 3D maps are cool :)
julianhoffmann.bsky.social
The Geology of the Moon. Still frames from my experimental animation. #b3d
julianhoffmann.bsky.social
fantastic project/data/idea!
alexselbyb.bsky.social
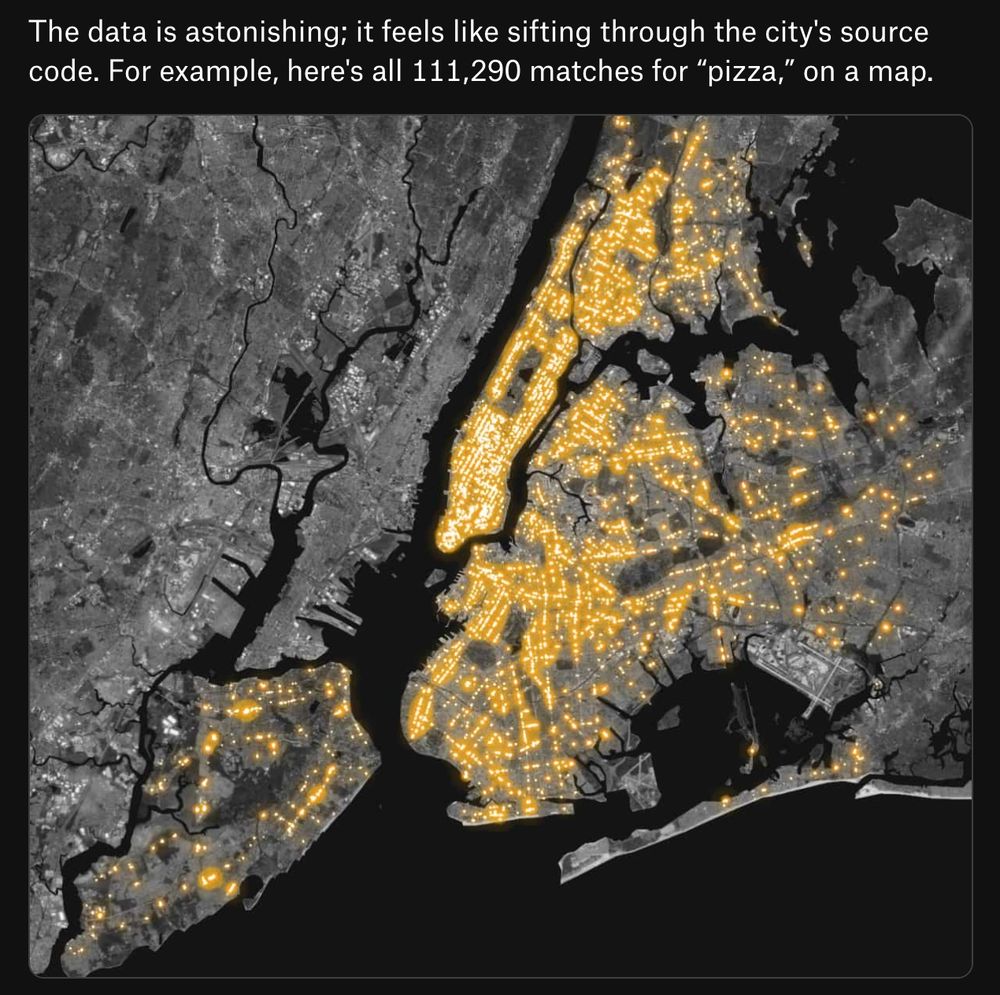
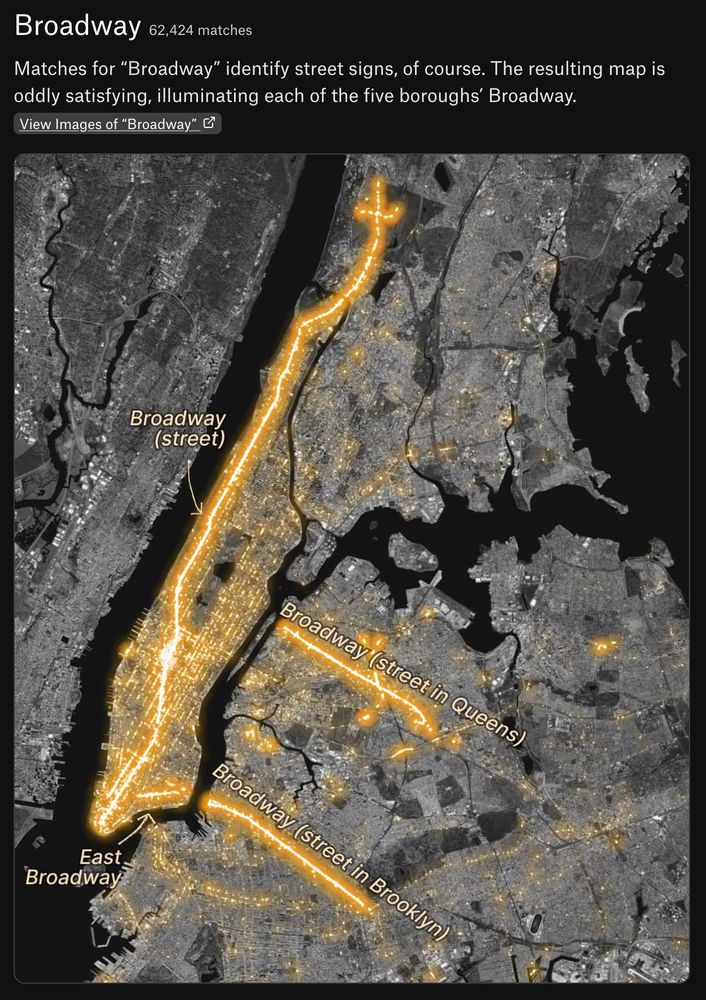
Love these maps of "street-text sightings" in the Pudding's latest piece
pudding.cool/2025/07/stre...
julianhoffmann.bsky.social
Downtown LA × Hollywood - Elevation visualization concept map. Experimental design. #b3d
Reposted by Julian Hoffmann Anton
instascience.bsky.social
A mesmerizing time-lapse of the Sun in ultraviolet light, captured by the Solar Dynamics Observatory spacecraft over a month.

-Credits: NASA
julianhoffmann.bsky.social
Thanks!! I will make more of these for sure :) Is there any city you would like to see?
julianhoffmann.bsky.social
Orthographic City Design 0722 | Chicago OSM
#Day31 of sharing work-in-progress. 3D maps are cool :)
Reposted by Julian Hoffmann Anton
julianhoffmann.bsky.social
Do you know NYC Midtown's top 6 highest buildings and surroundings? Have a look, here is an experimental orthographic view I made! #gis #b3d
Reposted by Julian Hoffmann Anton
julianhoffmann.bsky.social
World population 1950-2100 visualisation BTS. #Day5 of sharing work-in-progress. Blender view, analysis in #Rstats | Experimental #dataviz animated cartogram - UN Population Prospects data portal ⬇️
Reposted by Julian Hoffmann Anton
julianhoffmann.bsky.social
“The Batmap” | An experiment with New York City data. #Day26 of sharing work-in-progress. A playful twist on “the bad map” that inspired this cinematic rendering, created in #Blender3D with Google 3D Map Tiles from late 2023. #batman
Reposted by Julian Hoffmann Anton
satellitesci.bsky.social
One of my favourite data discoveries this year: Google's mind-blowing ARCO-ERA5 dataset: hourly data for ~300 climate variables, available globally from 1940! 🤯

Loadable with a single line of Python code from a single cloud-friendly Zarr file! Below: a month of wind waves + swell: 🌊
Reposted by Julian Hoffmann Anton
julianhoffmann.bsky.social
Bridges to the City of London*, meshes and render. #Day7 of sharing work-in-progress. ⬇️ Experimental 3D map in #b3d
Reposted by Julian Hoffmann Anton
alexselbyb.bsky.social
Charts that will be studied by historians, an occasional series
Two world maps and a chart from The Economist showing which countries share greater trade with the US or with China. In the first map, labelled 2000, most countries trade more with the US than with China; in the second map, labelled 2020, most countries trade more with China. The chart shows that China's comparative share of global trade has increased from less than 25% to nearly 75% in 20 years Chart from The Economist showing the net favourability of the US and China in 100 countries. In 2022, China had net negative favourability while the US was positive; in 2025 their positions have reversed
Reposted by Julian Hoffmann Anton
julianhoffmann.bsky.social
Sea Surface Wind: January 10-12th 2025. Exploring innovative ways to display climate data of our beautiful planet. Globe & map visualisation made for @copernicusmarine.bsky.social #Day22 of sharing work in progress 🌍 🔊 #b3d
julianhoffmann.bsky.social
“The Batmap” | An experiment with New York City data. #Day26 of sharing work-in-progress. A playful twist on “the bad map” that inspired this cinematic rendering, created in #Blender3D with Google 3D Map Tiles from late 2023. #batman
Reposted by Julian Hoffmann Anton
oliviafvane.bsky.social
This map shows the hour of sunrise globally through the year. It reveals time zones following national and, sometimes, regional boundaries, and slicing through the oceans.
Reposted by Julian Hoffmann Anton
simongerman600.bsky.social
This wonderful little map by @Julian_H0ffmann shows nothing but the lakes and rivers of Switzerland.
Reposted by Julian Hoffmann Anton
julianhoffmann.bsky.social
I remastered the survivor bias meme. Honestly, hoping this one does blow up. Make good use of it!
julianhoffmann.bsky.social
Sea Surface Wind: January 10-12th 2025. Exploring innovative ways to display climate data of our beautiful planet. Globe & map visualisation made for @copernicusmarine.bsky.social #Day22 of sharing work in progress 🌍 🔊 #b3d
Reposted by Julian Hoffmann Anton
janatausch.bsky.social
Join @julianhoffmann.bsky.social and me at Queen Mary's this Wednesday for some talks on data viz and more. I'll talk about visualising climate data in the newsroom amongst other things (and am v excited to hear more about Julian's 3D wizardry)

Register here and hope to see you there! 🗺️ 📈
Open Data Vis: Visual Insights & Networking
Data Visualisation evening and networking event for experts and enthusiasts. Speakers from the FT and QMUL/UCL.
www.eventbrite.co.uk