Joan León
@nucliweb.net
1.7K followers 430 following 400 posts
⚡️ Web Performance Artisan at @perf.reviews | Google Dev Expert in Web Tech | Cloudinary Ambassador | ❤️ Image Optimization | Girona
Posts Media Videos Starter Packs
Reposted by Joan León
tunetheweb.com
Core Web Vitals mystery for ya:

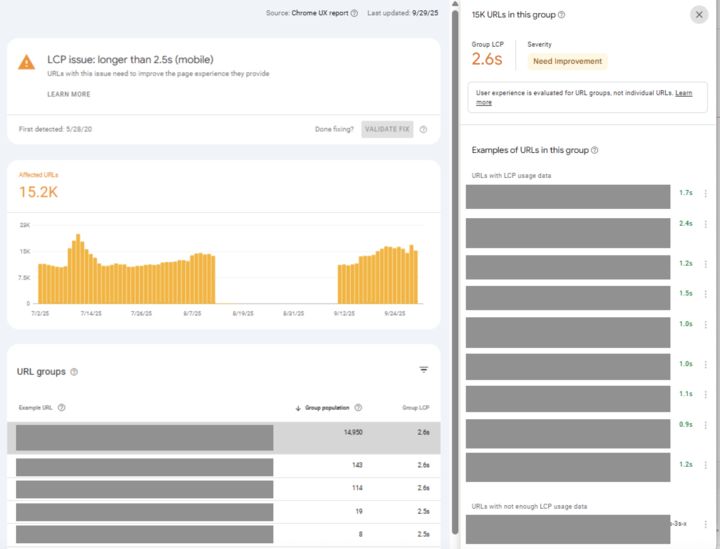
Why does Google Search Console same my LCP is bad, but every example URL has good LCP?

I see developers asking: How can this happen? Is GSC wrong? (I'm willing to bet it is not!) What can you do about it?

This is admittedly confusing so let's dive in...

🧵 1/12
Screenshot of Core Web Vitals graph in Google Search Console, with the URLs greyed out. The Group LCP is 2.6 seconds and so the group is in amber and saying there is an issue as it's longer than the 2.5 seconds "good" threshold. Yet all the examples have green LCPs of 1.7 seconds, 2.4 seconds, 1.2 seconds...etc. which is confusing.
nucliweb.net
New Web Performance challenge, improve the INP and LCP of this Web App.

Interaction to Next Paint
🟥 920ms in desktop
🟥 1800ms in mobile

Largest Contentful Paint
🟩 2.33s in desktop
🟥 4.13s in mobile

#WebPerformance #CoreWebVitals #INP
Reposted by Joan León
tomayac.com
On the Chrome team, we've a cool new origin trial for you to try in your apps: the Proofreader API: developer.chrome.com/docs/ai/proo....

❌ tyop → ✅ typo

```js
await (await Proofreader.create({
expectedInputLanguages: ['en'],
})).proofread(
'Let us knwo how it foes',
);
```

#BuiltInAI #WebAI
The Proofreader API  |  AI on Chrome  |  Chrome for Developers
Improve your content readability and grammar with the Proofreader API.
developer.chrome.com
nucliweb.net
#TIL You can sent multiple Server-Timing headers
Screenshot of HTTP response headers showing three Server-Timing entries: cfCacheStatus with value HIT, cfOrigin with duration 0 and cfEdge with duration 18, and cfExtPri with no value.
nucliweb.net
#WebPerfTip

If you need a GitHub Action to automatically compresses JPEGs, PNGs and WebPs in pull requests, IMHO this is the best option

#WebPerf #ImagePerf #PerfTools #Image
GitHub Actions bot comment showing that images were automatically compressed by Calibre’s image-actions. The comment reports a 47.1% reduction in image size, saving 104.46 KB. A table displays one example file (‘Screen Shot 2020-09-17 at 3.29.33 pm.png’) reduced from 221.87 KB to 117.41 KB. It notes that 348 images did not require optimisation, and includes a ‘View diff’ link for visual comparison.
Reposted by Joan León
squiggleconf.com
Want to debug your web app’s performance? DevTools has the answers: you just need to know where to look. @rviscomi.dev explains the hidden, upcoming, and all-around useful features of the Performance panel at SquiggleConf 2024.

youtu.be/nJ-h7UWdXZA
The Chrome DevTools Performance Panel | Rick Viscomi
YouTube video by SquiggleConf
youtu.be
Reposted by Joan León
csswizardry.com
👀 I’ve been working on a little something! There’s a link to the demo in the video description.

www.youtube.com/watch?v=IMww...
Obs.js Preview – Adapt to user context
YouTube video by Harry Roberts
www.youtube.com
nucliweb.net
Do you have a website with international visitors?

Check the Time to First Byte (TTFB) from different locations, and create a plan to improve it if your visitors are having a bad experience.

Start testing today, links in the first comment.

#WebPerf #PerfTools #Performance #TTFB
nucliweb.net
🔍 Found in a recent web performance audit:
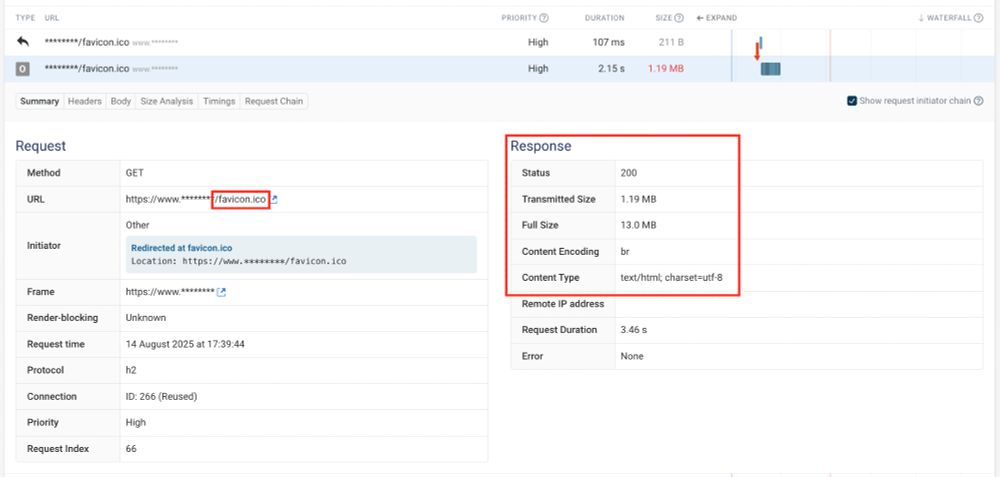
favicon.ico → 301 redirect → broken URL → returns 13 MB uncompressed HTML

⚠️ Even tiny assets can slow your site if misconfigured.
Check static files (favicon, images, CSS, JS) — small issues add up

#WebPerf #WebPerformance #Frontend #DevTips
A screenshot of a web browser's developer tools, specifically the network tab, showing the details of a network request for a "favicon.ico" file. The view is split into two main sections. The left section, under the "Request" heading, details the HTTP GET request, including the URL https://www.**********/favicon.ico (with the domain name obscured). The right section, under the "Response" heading, shows the server's response details. The highlighted information includes "Status: 200", "Transmitted Size: 1.19 MB", "Full Size: 13.0 MB", "Content Type: text/html; charset=utf-8", and "Request Duration: 3.46 s".
nucliweb.net
It's a great project 🙌
Reposted by Joan León

veneman.dev
I appreciate all 18 of you! +1 rank gained is still a plus in my book.
2025.stateofcss.com/en-US/other-...
State of CSS result table showing the "other tools" section. Project Wallace is listed near the bottom with 0.5% of respondents (18 people) indicating they use it. A tooltip says there's a +1 increase in rank.
nucliweb.net
It’s the idea of option 3, thank you for the feedback 🫶
nucliweb.net
As a techie, I totally agree.

I’d love to hear the perspectives of people from SEO, Marketing, UX, Product, and Management.
nucliweb.net
In a Web Performance book, when technical references are made, which would you prefer?

1️⃣ Link to external refs, keeping reading high-level
2️⃣ Go into detail with the tech explanation
3️⃣ Both, deep dive in a distinct visual format so it can be skipped if desired

e.g.: Avoid long tasks in JavaScript
nucliweb.net
I'm in ☺️
csswizardry.com
🧑‍💻 I wasn’t going to mention this until next week but it’s Friday—treat yourself!

I’ve just launched a members-only subscription: screencasts, Q&A, mentoring, discounts, and more.

👉 csswizardry.gumroad.com/l/subscribe
Subscribe
I’ve been writing or creating content in some form or another since 2009. Some of you have been with me since the very beginning. That over 15 years!The articles and research I publish on csswizardry....
csswizardry.gumroad.com
nucliweb.net
📉 E-commerce site with LCP > 6s, INP > 2800ms, CLS > 1.1
Broken UX = lost sales.

💡 Performance isn’t just for devs.
It’s key to convert, retain, and grow.

Is your site fast enough to keep up with your customers?

#WebPerf #UX #CRO #eCommerce
Performance metrics from a web performance tool showing results for a mid-tier mobile device with a fast 4G network. The metrics are divided into Local and Field (URL) data. Under the Local tab: LCP (Largest Contentful Paint) is 3.59 seconds, INP (Interaction to Next Paint) is 319 milliseconds, and CLS (Cumulative Layout Shift) is 0.91. Under the Field (URL) tab: LCP is 6.19 seconds, INP is 2827 milliseconds, and CLS is 1.16. All values are highlighted in red or orange, indicating poor performance.
Reposted by Joan León
en.sitnik.ru
This is me a couple of days before the first release of PostCSS.

From my new article about the history of PostCSS and the lessons I learned from it (for example, how to break an API when you have 400M downloads per month).

evilmartians.com/chronicles/w...
Reposted by Joan León
csswizardry.com
Same code, same infrastructure, different context. Web performance is sometimes an ‘us thing’ and sometimes a ‘them thing’. For better or worse, we have a responsibility to cater to both.