Dr. Nina Davtian (she/her/hers)
@ninadavtian.bsky.social
3.9K followers 2.1K following 550 posts
@cnrs-insu.bsky.social researcher at @climatecerege.bsky.social. Using biomarkers to study climate, ocean, and environment of the past. @icta-uab.bsky.social alumna. ORCID: https://orcid.org/0000-0002-3047-6064 🇫🇷 -> 🇪🇸 -> 🇫🇷
Posts Media Videos Starter Packs
Pinned
ninadavtian.bsky.social
Hello! 👋🏻
Trained as a geologist, I do paleo-reconstructions using molecular fossils, aka biomarkers.
My favorite biomarkers are archaeal and bacterial membrane-spanning lipids—glycerol dialkyl glycerol tetraethers, GDGTs.
A 🧵 of 🧵 on my five most significant papers in chronological order: 👇🏻
(1/7)
White mug with two membrane-spanning lipids drawn on it. The molecule drawn in green is a bacterial membrane lipid whereas the molecule drawn in blue, red, and yellow is a famous archaeal membrane lipid named crenarchaeol. Mug acquired during the 2nd international GDGT workshop on 6–8 September 2023 at ETH Zürich, Switzerland. Photo taken by Nina Davtian (it's me!).
Reposted by Dr. Nina Davtian (she/her/hers)
katharinehayhoe.com
This week's Talking Climate is guest-edited by the A of the band AJR. Adam is passionate about climate action and has teamed up with Ticketmaster + more to activate fans in creative new ways.

You won't want to miss this one! Read here: us14.campaign-archive.com?u=fa37a09043...
A screenshot of my Talking Climate newsletter with the headline: "Activating people through music, getting off autopilot, and connecting for change."
Reposted by Dr. Nina Davtian (she/her/hers)
bonpote.com
Les médias parlent trop peu d’écologie en France. Surtout, ils parlent de tous les sujets sans faire le lien avec le climat ou la biodiversité. 5%, c’est ridicule, compte tenu des enjeux.

Soutenons la presse indépendante et encourageons les autres médias à faire mieux.
Reposted by Dr. Nina Davtian (she/her/hers)
zacklabe.com
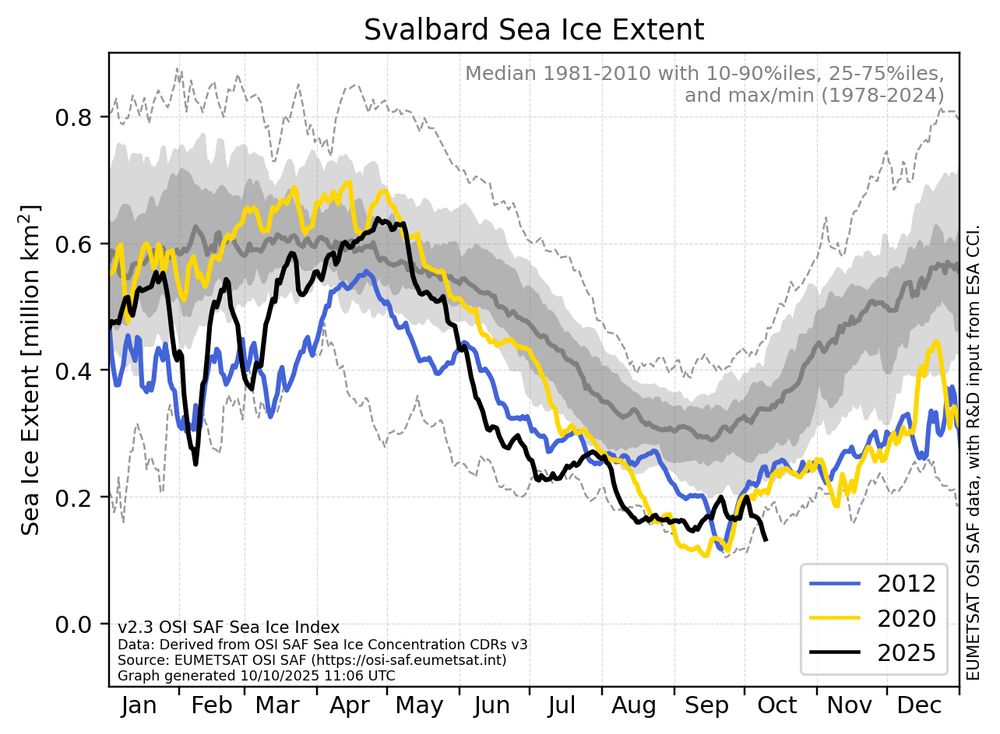
Here is a closer look at the record low #Arctic sea ice around Svalbard currently. This coincides with the record warmth as well (check out my earlier post). Earlier last week temperatures in parts of Svalbard were more similar to July than October.

Graphic produced by cryo.met.no/en/sea-ice-i...
Line graph time series of Svalbard sea ice area for 2025 compared to 2012 2020, and the 1981-2010 average with percentiles shown. There is a large seasonal cycle.
Reposted by Dr. Nina Davtian (she/her/hers)
icebird.bsky.social
I also flew my drone this morning, and you can watch that video here:

youtu.be/h0mdC09o2wo?...

#OceanDevotion
Reposted by Dr. Nina Davtian (she/her/hers)
zacklabe.com
Record high temperatures are currently being set across the northernmost portions of the #Arctic. In fact, it is effectively ice-free on the Atlantic side of the Arctic all the way up to about 85°N latitude! This includes record low sea ice around Svalbard.

Graphic by zacklabe.com/arctic-tempe...
Line graph time series of 2025's daily 2-m temperature in the Arctic compared to each year from 1958 through 2024. There is a long-term warming trend for every day of the year. There is also large interannual variability and a clear seasonal cycle.
Reposted by Dr. Nina Davtian (she/her/hers)
palaeopercs.bsky.social
You can see David's abstract here (with alt text):
(2/4)
Marine phytoplankton play an important part within the global carbon cycle, removing great amounts of carbon from the atmosphere and producing around half of the atmospheric oxygen today. Furthermore, forming the largest part of the base of aquatic food chains, phytoplankton represent the starting point of biological activities in the oceans. Therefore, the study of ancient phytoplankton dynamics at regional and global scales can provide valuable insights into the evolution of marine ecosystems.
Reposted by Dr. Nina Davtian (she/her/hers)
palaeopercs.bsky.social
Next week at #PalaeoPERCS we will be joined by David Kröck from University in Shenzhen, China.
Sign up here: paleopercs.com/participate/
(1/4)
Reposted by Dr. Nina Davtian (she/her/hers)
oceanhelen.bsky.social
University of Queensland in brisbane is hosting the Plastics 2026 #plastics2026 conference.abstracts open now.
Plastics2026 - A global symposium on plastics and human health | 1-4 March 2026
qaehs.centre.uq.edu.au
Reposted by Dr. Nina Davtian (she/her/hers)
mineralcup.bsky.social
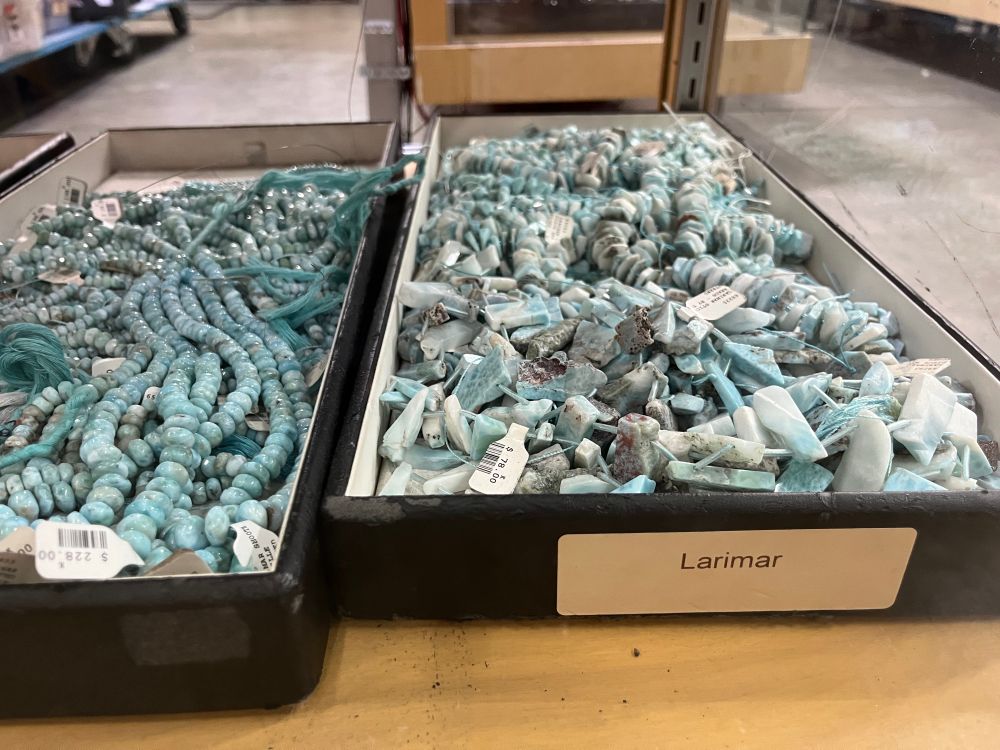
Why hello, minerals from Cups past!

It’s always fun to see our contenders (and some Champions) at an affordable price tag in local rock shops.
Black kyanite fans in small cardboard half-boxes Box of raw pale blue larimar with polished beads in the adjacent box A box of rough cream and pink rhodochrosite priced per ounce Box of rainbow-tarnished bornite ore
Reposted by Dr. Nina Davtian (she/her/hers)
chrislowery.bsky.social
Happy #FossilFriday, the University of Texas is hiring two curators/non-TT professors for our Vertebrate and Non-vertebrate Paleontology Labs: apply.interfolio.com/175702
Apply - Interfolio {{$ctrl.$state.data.pageTitle}} - Apply - Interfolio
apply.interfolio.com
Reposted by Dr. Nina Davtian (she/her/hers)
ruthmottram.bsky.social
My brilliant @polarres.bsky.social colleagues beat me to it. The evaluation for #Antarctica is out before I have done the model protocol paper! It's a great piece of work and if you're interested in high resolution climate information from RCMs, read it ❄️🌊🥼⚒️
egusphere.copernicus.org/preprints/20...
EGUsphere - The PolarRES dataset: a state-of-the-art regional climate model ensemble for understanding Antarctic climate
Abstract. Antarctica's weather and climate have global impacts, influencing weather patterns, ocean currents and sea levels worldwide. However, Antarctica is vast and complex, and the atmospheric processes that govern its climate are strongly influenced by its steep terrain, particularly around the coastal periphery. Our scientific understanding of this complex environment is hampered by the lack of reliable observations and gridded datasets at sufficiently high spatial and temporal resolution. High-resolution regional climate models, RCMs, can provide a solution to the sparsity of observational data and low resolution of reanalyses, facilitating more in-depth assessments of crucial climate variables like precipitation, winds and temperatures that are strongly influenced by topography. Here we present and evaluate a comprehensive, high-quality, ~ 11 km resolution RCM dataset: the PolarRES ensemble. We show that the ensemble largely out-performs ERA5, particularly for variables such as coastal winds and in characterising high-resolution regional precipitation patterns. There are no consistent seasonal differences in biases, but there are persistent regional biases. The Victoria Land region is the region the RCMs and ERA5 struggle the most with, which suggests that further investigation and model development is needed in this area. Each RCM has strengths and limitations, but overall the ensemble captures the observed weather and climate of Antarctica well. The PolarRES ensemble offers a novel and exciting way of evaluating climate processes and features, and we encourage researchers to use the data, which are freely available, to explore pertinent climate questions of local, regional and global significance.
egusphere.copernicus.org
Reposted by Dr. Nina Davtian (she/her/hers)
estevecorbera.bsky.social
Researching on how green "transition" projects influence land tenure? Please consider sending your next paper to this POLLEN 2026 panel, co-organised with Inge-Merete Hougaard (Uni of Copenhagen).
"Land dynamics in the green transition" (P034): pollenpoliticalecology.network/pollen-2026/...
Programme - POLLEN
Login
pollenpoliticalecology.network
Reposted by Dr. Nina Davtian (she/her/hers)
zacklabe.com
This morning was the first frost and freeze for many across the Northeast. As a snow/winter fan, I am very excited! 🥶

Check out @climatecentral.org's latest analysis this week on how the first freeze is getting later due to climate change across CONUS: www.climatecentral.org/climate-matt...
Map showing the average first freeze date across the contiguous United States. Data is from RCC ACIS, and the graphic was created by Climate Central.
Reposted by Dr. Nina Davtian (she/her/hers)
zacklabe.com
Friday ice update - #Arctic sea ice extent is currently the 11th lowest on record (JAXA data)

• about 20,000 km² below the 2010s mean
• about 1,300,000 km² below the 2000s mean
• about 2,400,000 km² below the 1990s mean
• about 3,040,000 km² below the 1980s mean

More: zacklabe.com/arctic-sea-i...
Line graph time series of 2025's daily Arctic sea ice extent compared to decadal averages from the 1980s to the 2010s. The decadal averages are shown with different colored lines with purple for the 1980s, blue for the 1990s, green for the 2000s, and white for the 2010s. Thin white lines are also shown for each year from 2000 to 2024. 2025 is shown with a thick gold line. There is a long-term decreasing trend in ice extent for every day of the year shown on this graph between August and November by looking at the decadal average line positions.
Reposted by Dr. Nina Davtian (she/her/hers)
cnrs.fr
CNRS @cnrs.fr · 1d
#Communiqué 🗞️ Des océans ont-ils un jour recouvert la surface de Mars ?
Une équipe de recherche, qui a scruté la planète rouge grâce aux diverses sondes de la NASA et de l’ESA en orbite autour de Mars, livre de nouveaux résultats.

👉 www.cnrs.fr/fr/presse/oc...
Reposted by Dr. Nina Davtian (she/her/hers)
micefearboggis.bsky.social
Quasi monthly update of the monthly climate dashboard

The first September updates are starting to come in. Globally another very warm month.

www.jkclimate.fr/MonthlyDashb...
Graph showing monthly global mean temperature anomalies from 1850 (in varying shades of yellow, green then dark blue with colours getting darker over time) to 2025 (shown in red). Data are from six data sets: HadCRUT5, NOAAGlobalTemp v5, GISTEMP, Berkeley Earth, JRA-3Q and ERA5. The latest month shown is September 2025. Graph showing the ranking for monthly global mean temperature from six data sets between February 2023 and September 2025. Rankings are shown as coloured squares. Red is warmest on record (for that month and dataset), orange is second warmest, deep yellow (a beautiful shade that I want to call cadmium yellow but it's not toxic) means a top five month and pale yellow (the colour of sun-faded straw) is top ten. Nothing is outside that range. Every single warmest month in all datasets happened since July 2023.