


Tom Watts
@altfinance.bsky.social
Investment Analyst. Money Manager. Idaho to Wall Street strategist. HBS. McKinsey. Merrill. Uncovering the facts behind conventional wisdom. Run, bike, ski, and hang out with dog Buddy.
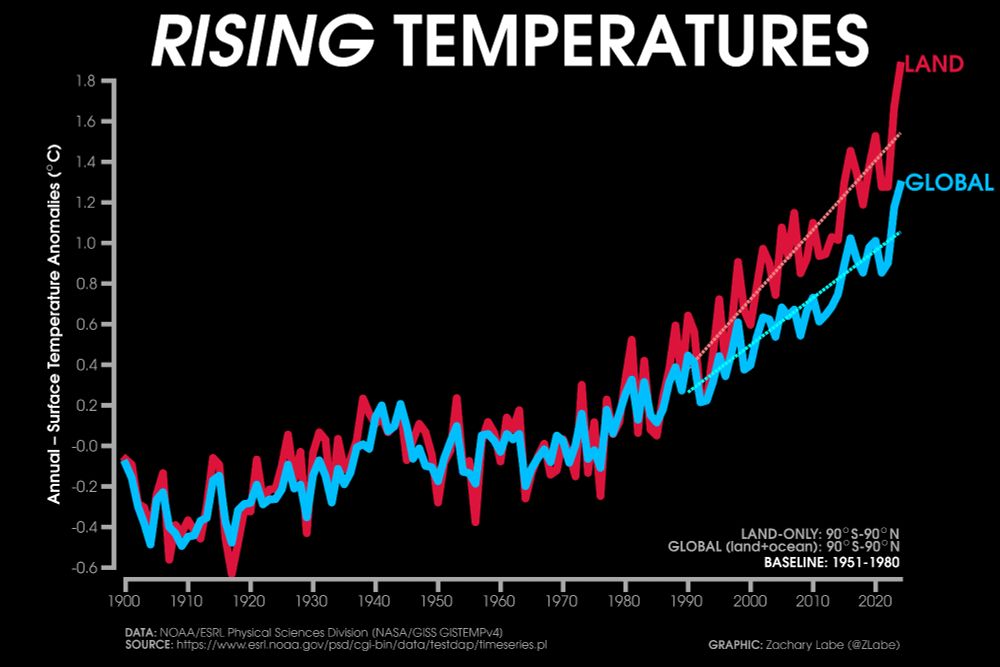
The rate of global warming already alarms us. “Land warming” is accelerating at twice the global rate, contributing to droughts, reduced agricultural production, and the prevalence of weather disruptions such as polar vortexes in the middle latitudes of the U.S. and Europe.

An updated look (through 2024) at how much faster the land is warming (where we live) - this point can be obscured in the standard global mean temperature plots... 🧪⚒️
+ Data from NASA GISTEMPv4: data.giss.nasa.gov/gistemp/
+ Download graphic at: zacklabe.com/climate-chan...
+ Data from NASA GISTEMPv4: data.giss.nasa.gov/gistemp/
+ Download graphic at: zacklabe.com/climate-chan...
January 19, 2025 at 3:03 PM
The rate of global warming already alarms us. “Land warming” is accelerating at twice the global rate, contributing to droughts, reduced agricultural production, and the prevalence of weather disruptions such as polar vortexes in the middle latitudes of the U.S. and Europe.
I have always sided with Warren Buffet’s take on gold, that it’s in the category of “assets that will never produce anything.” Recently, despite not producing anything, its price has far outperformed the S&P 500.
x.com/globalmktobs...
x.com/globalmktobs...
x.com
x.com
January 19, 2025 at 2:42 PM
I have always sided with Warren Buffet’s take on gold, that it’s in the category of “assets that will never produce anything.” Recently, despite not producing anything, its price has far outperformed the S&P 500.
x.com/globalmktobs...
x.com/globalmktobs...
Consumer debt delinquencies jumped to their highest level since the Great Financial Crisis.

January 18, 2025 at 5:28 AM
Consumer debt delinquencies jumped to their highest level since the Great Financial Crisis.
The Congressional Budget Office lowered its population forecast as a result of lower birth rates and reduced immigration. It also now projects deaths to exceed births by 2033, 7 years earlier than previously. We’re on track for a demographic train wreck like Japan, China, and Germany.

January 18, 2025 at 5:21 AM
The Congressional Budget Office lowered its population forecast as a result of lower birth rates and reduced immigration. It also now projects deaths to exceed births by 2033, 7 years earlier than previously. We’re on track for a demographic train wreck like Japan, China, and Germany.
x.com
x.com
January 18, 2025 at 5:14 AM
The Fed’s higher short-term interest rates are meant to reduce economic growth which often reduces inflation. Frequently, the higher short-term interest rates slow the economy so much, that the economy goes into recession.
It’s not clear that will happen this time. But, this chart suggests it will.
It’s not clear that will happen this time. But, this chart suggests it will.
January 5, 2025 at 10:08 PM
The Fed’s higher short-term interest rates are meant to reduce economic growth which often reduces inflation. Frequently, the higher short-term interest rates slow the economy so much, that the economy goes into recession.
It’s not clear that will happen this time. But, this chart suggests it will.
It’s not clear that will happen this time. But, this chart suggests it will.
Yield curve inversion is when short-term rates are higher than long-term rates. This generally happens when the Federal Reserve raises short-term interest rates to try to slow inflation. The Fed manages the interest rate for overnight lending to banks, so it is very short term.
January 5, 2025 at 10:08 PM
Yield curve inversion is when short-term rates are higher than long-term rates. This generally happens when the Federal Reserve raises short-term interest rates to try to slow inflation. The Fed manages the interest rate for overnight lending to banks, so it is very short term.
Normally long-term interest rates are higher than short-term interest rates. For example, the interest rate on a 10-year bond is higher than that for a 1-year bond. The issuer must offer that to the bond holder, because the bond holder is taking more risk locking up their money at a given rate.
January 5, 2025 at 10:08 PM
Normally long-term interest rates are higher than short-term interest rates. For example, the interest rate on a 10-year bond is higher than that for a 1-year bond. The issuer must offer that to the bond holder, because the bond holder is taking more risk locking up their money at a given rate.
The S&P 500 suffered its largest decline from Christmas until New Years since at least 1952

January 4, 2025 at 9:44 PM
The S&P 500 suffered its largest decline from Christmas until New Years since at least 1952
The yield curve just un-inverted.
This happened in 1990, 2000, and 2008 - all 3 times leading to sharp downturns.
This happened in 1990, 2000, and 2008 - all 3 times leading to sharp downturns.

January 4, 2025 at 9:41 PM
The yield curve just un-inverted.
This happened in 1990, 2000, and 2008 - all 3 times leading to sharp downturns.
This happened in 1990, 2000, and 2008 - all 3 times leading to sharp downturns.
Trump begins blaming the Democrats for the recession/depression that could be coming.

December 30, 2024 at 6:51 PM
Trump begins blaming the Democrats for the recession/depression that could be coming.
CRE refinancing at 6+% rates could push many properties into default.
#maruritywall #CRE #investing #economy
#maruritywall #CRE #investing #economy

December 28, 2024 at 5:56 PM
CRE refinancing at 6+% rates could push many properties into default.
#maruritywall #CRE #investing #economy
#maruritywall #CRE #investing #economy
The trillion dollar maturity wall of Commercial Real Estate (CRE) mortgages promises a rise in default rates, as owners are forced to refinance at higher rates.

December 28, 2024 at 5:51 PM
The trillion dollar maturity wall of Commercial Real Estate (CRE) mortgages promises a rise in default rates, as owners are forced to refinance at higher rates.
U.S. population growth near zero. Without immigration, population would decline and age rapidly.

December 19, 2024 at 10:46 PM
U.S. population growth near zero. Without immigration, population would decline and age rapidly.
The Dow Jones down 10 days in a row - the longest losing stretch in history. And finally a bounce.

December 19, 2024 at 10:41 PM
The Dow Jones down 10 days in a row - the longest losing stretch in history. And finally a bounce.
56% of American consumers expect the stock market to go up in the next year - the most positive reading in stock market history.
bilello.blog/newsletter
Touch image for complete chart.
bilello.blog/newsletter
Touch image for complete chart.

December 17, 2024 at 11:32 PM
56% of American consumers expect the stock market to go up in the next year - the most positive reading in stock market history.
bilello.blog/newsletter
Touch image for complete chart.
bilello.blog/newsletter
Touch image for complete chart.
Reposted by Tom Watts

California on track to pass Germany as the World's 4th largest economy

December 16, 2024 at 10:52 AM
California on track to pass Germany as the World's 4th largest economy
Reposted by Tom Watts

$NVDA now in correction territory. Down 10% from closing high.

December 16, 2024 at 4:50 PM
$NVDA now in correction territory. Down 10% from closing high.
Reposted by Tom Watts

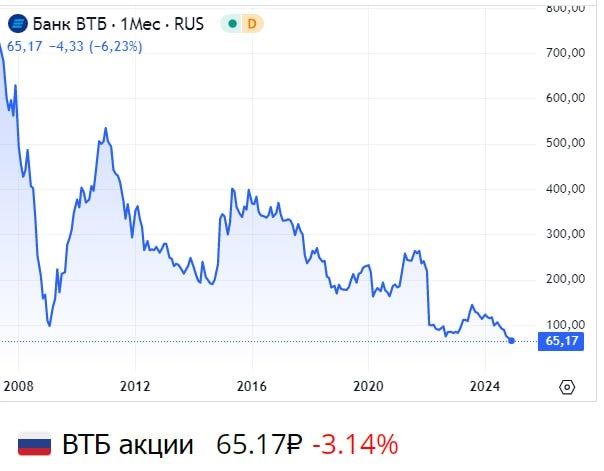
Let's pour one out for Russia's 2nd largest bank, heading to levels not since the 1990's when Russians were drinking cologne.
December 16, 2024 at 11:00 AM
Let's pour one out for Russia's 2nd largest bank, heading to levels not since the 1990's when Russians were drinking cologne.

China 10-year yield is plunging. It’s not officially a recession…

December 17, 2024 at 1:47 AM
China 10-year yield is plunging. It’s not officially a recession…
Reposted by Tom Watts
BTIG: “.. The bigger concern .. is whether the weakness in value/cyclicals is foretelling of something more ominous.
“.. the action in energy and materials this month is hard to ignore with XLB the most oversold since the fall of '22. If they can't bounce here, when will they?!” 👀
“.. the action in energy and materials this month is hard to ignore with XLB the most oversold since the fall of '22. If they can't bounce here, when will they?!” 👀

December 16, 2024 at 11:47 PM
BTIG: “.. The bigger concern .. is whether the weakness in value/cyclicals is foretelling of something more ominous.
“.. the action in energy and materials this month is hard to ignore with XLB the most oversold since the fall of '22. If they can't bounce here, when will they?!” 👀
“.. the action in energy and materials this month is hard to ignore with XLB the most oversold since the fall of '22. If they can't bounce here, when will they?!” 👀
Small cap stocks underperforming the NASDAQ 100 at a level not seen since the Dot Com Bubble in 2000.

December 14, 2024 at 5:54 PM
Small cap stocks underperforming the NASDAQ 100 at a level not seen since the Dot Com Bubble in 2000.
The top 10 stocks in the S&P 500 now account for 39% of total capitalization. The other 490 stocks are being left behind as market breadth continues to decline.

December 14, 2024 at 5:48 PM
The top 10 stocks in the S&P 500 now account for 39% of total capitalization. The other 490 stocks are being left behind as market breadth continues to decline.