


Andreas Bjerre-Nielsen
@andbjn.bsky.social
associate prof. of econ and social data science | topics: education & algorithms | methods: stats, machine learning & econ. theory | dad
11/
The work was led by Jolien Cremers, Benjamin Kohler, Benjamin F. Maier and done in collaboration with Stine N. Eriksen, Johanna Einsiedler, Frederik K. Christensen, @sunelehmann.com, David D. Lassen, Laust Hvas Mortensen. We are grateful for funding by the Villum Foundation.
The work was led by Jolien Cremers, Benjamin Kohler, Benjamin F. Maier and done in collaboration with Stine N. Eriksen, Johanna Einsiedler, Frederik K. Christensen, @sunelehmann.com, David D. Lassen, Laust Hvas Mortensen. We are grateful for funding by the Villum Foundation.
July 29, 2025 at 3:35 PM
11/
The work was led by Jolien Cremers, Benjamin Kohler, Benjamin F. Maier and done in collaboration with Stine N. Eriksen, Johanna Einsiedler, Frederik K. Christensen, @sunelehmann.com, David D. Lassen, Laust Hvas Mortensen. We are grateful for funding by the Villum Foundation.
The work was led by Jolien Cremers, Benjamin Kohler, Benjamin F. Maier and done in collaboration with Stine N. Eriksen, Johanna Einsiedler, Frederik K. Christensen, @sunelehmann.com, David D. Lassen, Laust Hvas Mortensen. We are grateful for funding by the Villum Foundation.
10/
We build on earlier work by @drtomemery.bsky.social and colleagues, who constructed the Dutch administrative network 🇳🇱.
Our network adds temporal depth and enables computationally scalable analysis at the national level.
We build on earlier work by @drtomemery.bsky.social and colleagues, who constructed the Dutch administrative network 🇳🇱.
Our network adds temporal depth and enables computationally scalable analysis at the national level.
July 29, 2025 at 3:35 PM
10/
We build on earlier work by @drtomemery.bsky.social and colleagues, who constructed the Dutch administrative network 🇳🇱.
Our network adds temporal depth and enables computationally scalable analysis at the national level.
We build on earlier work by @drtomemery.bsky.social and colleagues, who constructed the Dutch administrative network 🇳🇱.
Our network adds temporal depth and enables computationally scalable analysis at the national level.
9/
This dataset opens new doors for research on:
– Inequality & opportunity
– Social cohesion
– Spatial structure
– Peer effects
…all grounded in real, registry-based, population-wide data.
This dataset opens new doors for research on:
– Inequality & opportunity
– Social cohesion
– Spatial structure
– Peer effects
…all grounded in real, registry-based, population-wide data.
July 29, 2025 at 3:35 PM
9/
This dataset opens new doors for research on:
– Inequality & opportunity
– Social cohesion
– Spatial structure
– Peer effects
…all grounded in real, registry-based, population-wide data.
This dataset opens new doors for research on:
– Inequality & opportunity
– Social cohesion
– Spatial structure
– Peer effects
…all grounded in real, registry-based, population-wide data.
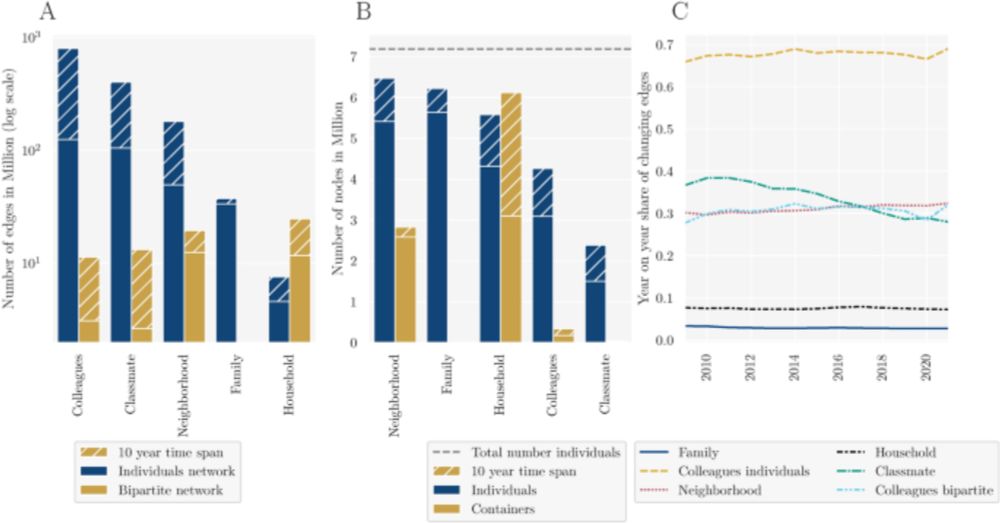
8/
To handle 1.4 billion ties, we used a bipartite network representation — linking individuals to shared foci like workplaces, schools, or households.
This reduced edge count by up to 98%, making large-scale analysis feasible.
To handle 1.4 billion ties, we used a bipartite network representation — linking individuals to shared foci like workplaces, schools, or households.
This reduced edge count by up to 98%, making large-scale analysis feasible.
July 29, 2025 at 3:35 PM
8/
To handle 1.4 billion ties, we used a bipartite network representation — linking individuals to shared foci like workplaces, schools, or households.
This reduced edge count by up to 98%, making large-scale analysis feasible.
To handle 1.4 billion ties, we used a bipartite network representation — linking individuals to shared foci like workplaces, schools, or households.
This reduced edge count by up to 98%, making large-scale analysis feasible.
7/
Social connectivity is highly unequal:
The top 20% of individuals hold nearly half the ties in some layers.
Over time, the well-connected in one layer become central in others too — interlayer centrality accumulates.
Social connectivity is highly unequal:
The top 20% of individuals hold nearly half the ties in some layers.
Over time, the well-connected in one layer become central in others too — interlayer centrality accumulates.
July 29, 2025 at 3:35 PM
7/
Social connectivity is highly unequal:
The top 20% of individuals hold nearly half the ties in some layers.
Over time, the well-connected in one layer become central in others too — interlayer centrality accumulates.
Social connectivity is highly unequal:
The top 20% of individuals hold nearly half the ties in some layers.
Over time, the well-connected in one layer become central in others too — interlayer centrality accumulates.
6/
📍 Geography matters.
People are much more likely to be socially connected if they live nearby.
Probability of connection drops steeply after 100m — confirming that spatial proximity underpins social proximity.
📍 Geography matters.
People are much more likely to be socially connected if they live nearby.
Probability of connection drops steeply after 100m — confirming that spatial proximity underpins social proximity.
July 29, 2025 at 3:35 PM
6/
📍 Geography matters.
People are much more likely to be socially connected if they live nearby.
Probability of connection drops steeply after 100m — confirming that spatial proximity underpins social proximity.
📍 Geography matters.
People are much more likely to be socially connected if they live nearby.
Probability of connection drops steeply after 100m — confirming that spatial proximity underpins social proximity.
5/
By combining and weighting layers, we uncover a familiar pattern: The average shortest path is around 6 — echoing the “six degrees of separation” concept.
But only when accounting for the structure and strength of ties.
By combining and weighting layers, we uncover a familiar pattern: The average shortest path is around 6 — echoing the “six degrees of separation” concept.
But only when accounting for the structure and strength of ties.
July 29, 2025 at 3:35 PM
5/
By combining and weighting layers, we uncover a familiar pattern: The average shortest path is around 6 — echoing the “six degrees of separation” concept.
But only when accounting for the structure and strength of ties.
By combining and weighting layers, we uncover a familiar pattern: The average shortest path is around 6 — echoing the “six degrees of separation” concept.
But only when accounting for the structure and strength of ties.
4/
Social network position reflects income:
Higher-income individuals tend to have more ties — especially when past ties are included.
The more central you are, the higher you tend to be in the income distribution.
Social network position reflects income:
Higher-income individuals tend to have more ties — especially when past ties are included.
The more central you are, the higher you tend to be in the income distribution.
July 29, 2025 at 3:35 PM
4/
Social network position reflects income:
Higher-income individuals tend to have more ties — especially when past ties are included.
The more central you are, the higher you tend to be in the income distribution.
Social network position reflects income:
Higher-income individuals tend to have more ties — especially when past ties are included.
The more central you are, the higher you tend to be in the income distribution.
3/
We find that social ties persist and resurface — former classmates become neighbors, colleagues become family.
Connections across life stages create dense, overlapping social paths.
We find that social ties persist and resurface — former classmates become neighbors, colleagues become family.
Connections across life stages create dense, overlapping social paths.
July 29, 2025 at 3:35 PM
3/
We find that social ties persist and resurface — former classmates become neighbors, colleagues become family.
Connections across life stages create dense, overlapping social paths.
We find that social ties persist and resurface — former classmates become neighbors, colleagues become family.
Connections across life stages create dense, overlapping social paths.
2/
We mapped social ties through five layers:
👨👩👧 Family
🏠 Households
📍 Neighborhoods
🎓 Classmates
💼 Colleagues
…across 2008–2021. The result is a dynamic, multiplex network of the entire population.
We mapped social ties through five layers:
👨👩👧 Family
🏠 Households
📍 Neighborhoods
🎓 Classmates
💼 Colleagues
…across 2008–2021. The result is a dynamic, multiplex network of the entire population.
July 29, 2025 at 3:35 PM
2/
We mapped social ties through five layers:
👨👩👧 Family
🏠 Households
📍 Neighborhoods
🎓 Classmates
💼 Colleagues
…across 2008–2021. The result is a dynamic, multiplex network of the entire population.
We mapped social ties through five layers:
👨👩👧 Family
🏠 Households
📍 Neighborhoods
🎓 Classmates
💼 Colleagues
…across 2008–2021. The result is a dynamic, multiplex network of the entire population.
1/
What does the social fabric of an entire country look like?
We built a nation-scale social network of Denmark — 7.2 million people, 1.4 billion ties, 14 years of data.
Here’s what we found 👇
📄 doi.org/10.1038/s415...
#NetworkScience #Sociology
What does the social fabric of an entire country look like?
We built a nation-scale social network of Denmark — 7.2 million people, 1.4 billion ties, 14 years of data.
Here’s what we found 👇
📄 doi.org/10.1038/s415...
#NetworkScience #Sociology
Unveiling the social fabric through a temporal, nation-scale social network and its characteristics - Scientific Reports
Scientific Reports - Unveiling the social fabric through a temporal, nation-scale social network and its characteristics
doi.org
July 29, 2025 at 3:35 PM
1/
What does the social fabric of an entire country look like?
We built a nation-scale social network of Denmark — 7.2 million people, 1.4 billion ties, 14 years of data.
Here’s what we found 👇
📄 doi.org/10.1038/s415...
#NetworkScience #Sociology
What does the social fabric of an entire country look like?
We built a nation-scale social network of Denmark — 7.2 million people, 1.4 billion ties, 14 years of data.
Here’s what we found 👇
📄 doi.org/10.1038/s415...
#NetworkScience #Sociology
Reposted by Andreas Bjerre-Nielsen

While human behavior and the data describing it evolve over time, fairness is often evaluated at a single snapshot. Yet, as we show in our newly published paper, fairness is dynamic. We studied how fairness evolves in dropout prediction across enrollment and found that it shifts over time.

July 21, 2025 at 8:02 AM
While human behavior and the data describing it evolve over time, fairness is often evaluated at a single snapshot. Yet, as we show in our newly published paper, fairness is dynamic. We studied how fairness evolves in dropout prediction across enrollment and found that it shifts over time.
Can AI interviewers match humans in qualitative interviews?
We found:
🤖 AI asked more questions, yielding longer interviews
🧠 Responses to specific questions were longer in human-led interviews
📏 But response quality—specificity & relevance—was similar
See more below 👇
We found:
🤖 AI asked more questions, yielding longer interviews
🧠 Responses to specific questions were longer in human-led interviews
📏 But response quality—specificity & relevance—was similar
See more below 👇
July 23, 2025 at 8:32 PM
Can AI interviewers match humans in qualitative interviews?
We found:
🤖 AI asked more questions, yielding longer interviews
🧠 Responses to specific questions were longer in human-led interviews
📏 But response quality—specificity & relevance—was similar
See more below 👇
We found:
🤖 AI asked more questions, yielding longer interviews
🧠 Responses to specific questions were longer in human-led interviews
📏 But response quality—specificity & relevance—was similar
See more below 👇