


@appliedepi.bsky.social
Improving Applied Epidemiology worldwide. Increasing the knowledge and resources of Epidemiologists no matter who or where they are.
Creator of the EpiRHandbook: https://epirhandbook.com/
Creator of the EpiRHandbook: https://epirhandbook.com/
Pinned
Hello Bluesky! We’re Applied Epi! What do we want? To improve Applied Epidemiology worldwide! When do we want it? Well probably in an achievable timeframe that doesn’t completely destroy a much needed and already existing infrastructure that is overburdened!
Reposted
🌍 Join the Board of Applied Epi!
We’re seeking new Board Members passionate about global health & Epidemiology.
Help guide a nonprofit that trains 1000s worldwide in data-driven public health response.
⏰ ~2 hrs/month | Apply by 31 Dec 2025
🔗 tinyurl.com/4yp5fu93
We’re seeking new Board Members passionate about global health & Epidemiology.
Help guide a nonprofit that trains 1000s worldwide in data-driven public health response.
⏰ ~2 hrs/month | Apply by 31 Dec 2025
🔗 tinyurl.com/4yp5fu93
October 31, 2025 at 8:29 AM
🌍 Join the Board of Applied Epi!
We’re seeking new Board Members passionate about global health & Epidemiology.
Help guide a nonprofit that trains 1000s worldwide in data-driven public health response.
⏰ ~2 hrs/month | Apply by 31 Dec 2025
🔗 tinyurl.com/4yp5fu93
We’re seeking new Board Members passionate about global health & Epidemiology.
Help guide a nonprofit that trains 1000s worldwide in data-driven public health response.
⏰ ~2 hrs/month | Apply by 31 Dec 2025
🔗 tinyurl.com/4yp5fu93
October 31, 2025 at 8:29 AM
🌍 Join the Board of Applied Epi!
We’re seeking new Board Members passionate about global health & Epidemiology.
Help guide a nonprofit that trains 1000s worldwide in data-driven public health response.
⏰ ~2 hrs/month | Apply by 31 Dec 2025
🔗 tinyurl.com/4yp5fu93
We’re seeking new Board Members passionate about global health & Epidemiology.
Help guide a nonprofit that trains 1000s worldwide in data-driven public health response.
⏰ ~2 hrs/month | Apply by 31 Dec 2025
🔗 tinyurl.com/4yp5fu93
We're hiring!
Applied Epi is looking for a capable epidemiologist for a full-time 1-year remote contractor position.
Take a look at our website for more details on the role and how to apply: appliedepi.org/about/join.h...
Application deadline: July 31, 2025.
Applied Epi is looking for a capable epidemiologist for a full-time 1-year remote contractor position.
Take a look at our website for more details on the role and how to apply: appliedepi.org/about/join.h...
Application deadline: July 31, 2025.
join – Applied Epi
lnkd.in
July 14, 2025 at 12:43 PM
We're hiring!
Applied Epi is looking for a capable epidemiologist for a full-time 1-year remote contractor position.
Take a look at our website for more details on the role and how to apply: appliedepi.org/about/join.h...
Application deadline: July 31, 2025.
Applied Epi is looking for a capable epidemiologist for a full-time 1-year remote contractor position.
Take a look at our website for more details on the role and how to apply: appliedepi.org/about/join.h...
Application deadline: July 31, 2025.
🚨 Rare opportunity! Our advanced R courses start end of July:
📈 Time series & outbreak detection in R
📊 Intro to Stats in R
🗺️ Intro to GIS in R
🖥️ Shiny in R
📝 Advanced R Markdown
Plus: Lots of Intro to R courses running all summer! 🌞
Taught live by experienced epidemiologists. 🌍
🔗 appliedepi.org
📈 Time series & outbreak detection in R
📊 Intro to Stats in R
🗺️ Intro to GIS in R
🖥️ Shiny in R
📝 Advanced R Markdown
Plus: Lots of Intro to R courses running all summer! 🌞
Taught live by experienced epidemiologists. 🌍
🔗 appliedepi.org
June 10, 2025 at 5:26 PM
🚨 Rare opportunity! Our advanced R courses start end of July:
📈 Time series & outbreak detection in R
📊 Intro to Stats in R
🗺️ Intro to GIS in R
🖥️ Shiny in R
📝 Advanced R Markdown
Plus: Lots of Intro to R courses running all summer! 🌞
Taught live by experienced epidemiologists. 🌍
🔗 appliedepi.org
📈 Time series & outbreak detection in R
📊 Intro to Stats in R
🗺️ Intro to GIS in R
🖥️ Shiny in R
📝 Advanced R Markdown
Plus: Lots of Intro to R courses running all summer! 🌞
Taught live by experienced epidemiologists. 🌍
🔗 appliedepi.org
“I’ve taken several R trainings - this is the BEST!”
📢 New courses posted! Intro to R for public health
🗓️ 40 hours part-time, synchronous, with unlimited 1-on-1 coaching and options for ALL time zones.
✏️ Register: appliedepi.org/training/pub...
📢 New courses posted! Intro to R for public health
🗓️ 40 hours part-time, synchronous, with unlimited 1-on-1 coaching and options for ALL time zones.
✏️ Register: appliedepi.org/training/pub...

March 13, 2025 at 9:52 AM
“I’ve taken several R trainings - this is the BEST!”
📢 New courses posted! Intro to R for public health
🗓️ 40 hours part-time, synchronous, with unlimited 1-on-1 coaching and options for ALL time zones.
✏️ Register: appliedepi.org/training/pub...
📢 New courses posted! Intro to R for public health
🗓️ 40 hours part-time, synchronous, with unlimited 1-on-1 coaching and options for ALL time zones.
✏️ Register: appliedepi.org/training/pub...
📢 Last week to apply for the Applied Epi scholarships!
Transition your team to R with free or discounted courses and services.
Why apply?
✔️ Full or partial scholarships
✔️ Focused on strengthening public health capacity
🗓️ Apply by Feb 10, 2025! 🌐 appliedepi.org/training/scholarships-ae
Transition your team to R with free or discounted courses and services.
Why apply?
✔️ Full or partial scholarships
✔️ Focused on strengthening public health capacity
🗓️ Apply by Feb 10, 2025! 🌐 appliedepi.org/training/scholarships-ae

February 3, 2025 at 8:51 PM
📢 Last week to apply for the Applied Epi scholarships!
Transition your team to R with free or discounted courses and services.
Why apply?
✔️ Full or partial scholarships
✔️ Focused on strengthening public health capacity
🗓️ Apply by Feb 10, 2025! 🌐 appliedepi.org/training/scholarships-ae
Transition your team to R with free or discounted courses and services.
Why apply?
✔️ Full or partial scholarships
✔️ Focused on strengthening public health capacity
🗓️ Apply by Feb 10, 2025! 🌐 appliedepi.org/training/scholarships-ae
📢 Ready to move your team to R? Applied Epi’s scholarships are OPEN!
✅ Funding available for teams in LMICs
✅ Even teams of 1 can apply with leadership support
✅ Deadline: Feb 10, 2025
Why team applications? Collaboration ensures a smooth transition to R! Apply today: 🌐 appliedepi.org
✅ Funding available for teams in LMICs
✅ Even teams of 1 can apply with leadership support
✅ Deadline: Feb 10, 2025
Why team applications? Collaboration ensures a smooth transition to R! Apply today: 🌐 appliedepi.org
Applied Epi
appliedepi.org
January 27, 2025 at 3:55 PM
📢 Ready to move your team to R? Applied Epi’s scholarships are OPEN!
✅ Funding available for teams in LMICs
✅ Even teams of 1 can apply with leadership support
✅ Deadline: Feb 10, 2025
Why team applications? Collaboration ensures a smooth transition to R! Apply today: 🌐 appliedepi.org
✅ Funding available for teams in LMICs
✅ Even teams of 1 can apply with leadership support
✅ Deadline: Feb 10, 2025
Why team applications? Collaboration ensures a smooth transition to R! Apply today: 🌐 appliedepi.org
🚨 Applications are NOW OPEN for Applied Epi’s 2025 scholarships! 🚨
💡 For teams in low- & middle-income countries working in epidemiology, this is your chance to access funding for courses and support services that help transition to R.
🗓️ Deadline: Feb 10, 2025
🌐 Apply here: appliedepi.org
💡 For teams in low- & middle-income countries working in epidemiology, this is your chance to access funding for courses and support services that help transition to R.
🗓️ Deadline: Feb 10, 2025
🌐 Apply here: appliedepi.org
January 21, 2025 at 1:22 AM
🚨 Applications are NOW OPEN for Applied Epi’s 2025 scholarships! 🚨
💡 For teams in low- & middle-income countries working in epidemiology, this is your chance to access funding for courses and support services that help transition to R.
🗓️ Deadline: Feb 10, 2025
🌐 Apply here: appliedepi.org
💡 For teams in low- & middle-income countries working in epidemiology, this is your chance to access funding for courses and support services that help transition to R.
🗓️ Deadline: Feb 10, 2025
🌐 Apply here: appliedepi.org
🎉 R scholarship applications open on January 20!
If your team (government or nonprofit) works in applied epidemiology in a low- or middle-income country, you could get access to our Intro to R course and Support Desk! Details: appliedepi.org/training/sch...
#Rstats #epitwitter
If your team (government or nonprofit) works in applied epidemiology in a low- or middle-income country, you could get access to our Intro to R course and Support Desk! Details: appliedepi.org/training/sch...
#Rstats #epitwitter

January 17, 2025 at 5:04 PM
🎉 R scholarship applications open on January 20!
If your team (government or nonprofit) works in applied epidemiology in a low- or middle-income country, you could get access to our Intro to R course and Support Desk! Details: appliedepi.org/training/sch...
#Rstats #epitwitter
If your team (government or nonprofit) works in applied epidemiology in a low- or middle-income country, you could get access to our Intro to R course and Support Desk! Details: appliedepi.org/training/sch...
#Rstats #epitwitter
Today's post is for anyone with bdays this time of the year. We see you!
This includes our Exec Director, an expert in "combo Xmas/bday" presents! Happy birthday Neale! 🎂
On that note, ever work with multiple date columns but need to pick one? Use coalesce() to easily prioritize a value!
#Rstats
This includes our Exec Director, an expert in "combo Xmas/bday" presents! Happy birthday Neale! 🎂
On that note, ever work with multiple date columns but need to pick one? Use coalesce() to easily prioritize a value!
#Rstats

December 23, 2024 at 8:38 PM
Today's post is for anyone with bdays this time of the year. We see you!
This includes our Exec Director, an expert in "combo Xmas/bday" presents! Happy birthday Neale! 🎂
On that note, ever work with multiple date columns but need to pick one? Use coalesce() to easily prioritize a value!
#Rstats
This includes our Exec Director, an expert in "combo Xmas/bday" presents! Happy birthday Neale! 🎂
On that note, ever work with multiple date columns but need to pick one? Use coalesce() to easily prioritize a value!
#Rstats
🎄Day 22: An R Christmas Tree 🎄
There's still time to write your Christmas cards!
And what better captures the yuletide spirit than...R...
Seriously though, check out the {christmas} package by Jose Barrera-Gomez.. Stunning!
There's still time to write your Christmas cards!
And what better captures the yuletide spirit than...R...
Seriously though, check out the {christmas} package by Jose Barrera-Gomez.. Stunning!

December 22, 2024 at 9:25 PM
🎄Day 22: An R Christmas Tree 🎄
There's still time to write your Christmas cards!
And what better captures the yuletide spirit than...R...
Seriously though, check out the {christmas} package by Jose Barrera-Gomez.. Stunning!
There's still time to write your Christmas cards!
And what better captures the yuletide spirit than...R...
Seriously though, check out the {christmas} package by Jose Barrera-Gomez.. Stunning!
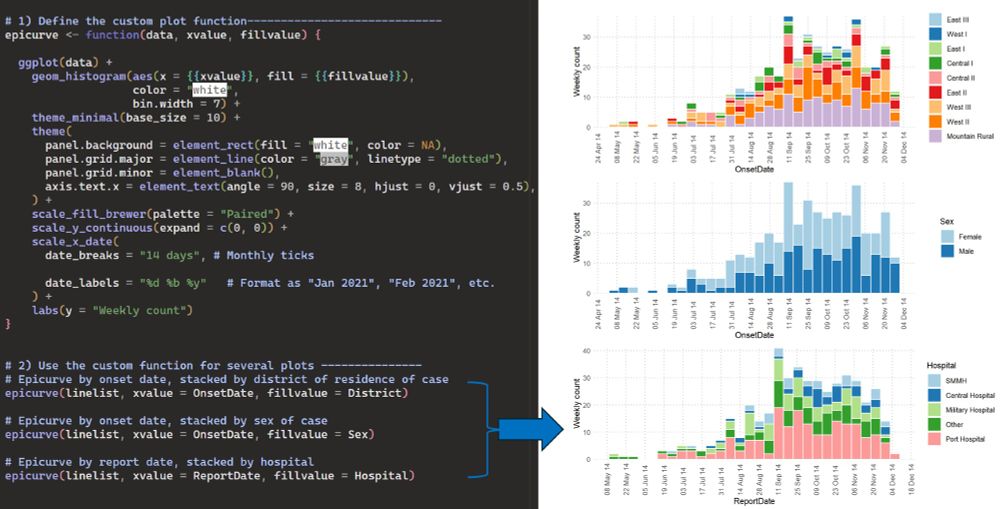
🎄Day 21: Ggplot efficiency part 3🎄
Need many plots with the same style/formatting but slightly different inputs?
💡Create a custom ggplot function!
Define your plot upfront in the function, with all the long formatting code. Then run the function for each new plot with different inputs.
Need many plots with the same style/formatting but slightly different inputs?
💡Create a custom ggplot function!
Define your plot upfront in the function, with all the long formatting code. Then run the function for each new plot with different inputs.
December 22, 2024 at 12:24 AM
🎄Day 21: Ggplot efficiency part 3🎄
Need many plots with the same style/formatting but slightly different inputs?
💡Create a custom ggplot function!
Define your plot upfront in the function, with all the long formatting code. Then run the function for each new plot with different inputs.
Need many plots with the same style/formatting but slightly different inputs?
💡Create a custom ggplot function!
Define your plot upfront in the function, with all the long formatting code. Then run the function for each new plot with different inputs.
🎄Day 20: Ggplot efficiency: part 2 🎄
Visualizing the same variables in different ways (e.g. sex by time/place)?
💡Tip: Easily standardize colour palettes by defining them once at the start of your code.
Then reuse the palettes within scale_fill_manual() or scale_color_manual() across plots.
Visualizing the same variables in different ways (e.g. sex by time/place)?
💡Tip: Easily standardize colour palettes by defining them once at the start of your code.
Then reuse the palettes within scale_fill_manual() or scale_color_manual() across plots.

December 21, 2024 at 3:31 AM
🎄Day 20: Ggplot efficiency: part 2 🎄
Visualizing the same variables in different ways (e.g. sex by time/place)?
💡Tip: Easily standardize colour palettes by defining them once at the start of your code.
Then reuse the palettes within scale_fill_manual() or scale_color_manual() across plots.
Visualizing the same variables in different ways (e.g. sex by time/place)?
💡Tip: Easily standardize colour palettes by defining them once at the start of your code.
Then reuse the palettes within scale_fill_manual() or scale_color_manual() across plots.
🎄Day 19: Ggplot efficiency: part 1🎄
Do you need a consistent plot style for a document?
Try theme_set()🎨
Define the look of fonts, grid lines, backgrounds, axis text etc once inside theme_set(). This will apply to all subsequent ggplots in your R session. No need for long theme() code per plot!
Do you need a consistent plot style for a document?
Try theme_set()🎨
Define the look of fonts, grid lines, backgrounds, axis text etc once inside theme_set(). This will apply to all subsequent ggplots in your R session. No need for long theme() code per plot!

December 20, 2024 at 1:27 AM
🎄Day 19: Ggplot efficiency: part 1🎄
Do you need a consistent plot style for a document?
Try theme_set()🎨
Define the look of fonts, grid lines, backgrounds, axis text etc once inside theme_set(). This will apply to all subsequent ggplots in your R session. No need for long theme() code per plot!
Do you need a consistent plot style for a document?
Try theme_set()🎨
Define the look of fonts, grid lines, backgrounds, axis text etc once inside theme_set(). This will apply to all subsequent ggplots in your R session. No need for long theme() code per plot!
🎄Day 18 🎄
Having a rough day?
The {praise} package is there for you.
Go on, give praise() a whirl.... ♥️
Having a rough day?
The {praise} package is there for you.
Go on, give praise() a whirl.... ♥️

December 18, 2024 at 10:13 PM
🎄Day 18 🎄
Having a rough day?
The {praise} package is there for you.
Go on, give praise() a whirl.... ♥️
Having a rough day?
The {praise} package is there for you.
Go on, give praise() a whirl.... ♥️
🎄Day 17: RStudio magic🎄
Want to be in multiple places at once over the holidays?
We can't help you with that.
But - we can show you how to type in multiple places at once in RStudio! 😮
Useful when you need to make the same edit across your code but Find + Replace isn't suitable.
Want to be in multiple places at once over the holidays?
We can't help you with that.
But - we can show you how to type in multiple places at once in RStudio! 😮
Useful when you need to make the same edit across your code but Find + Replace isn't suitable.
December 17, 2024 at 12:27 PM
🎄Day 17: RStudio magic🎄
Want to be in multiple places at once over the holidays?
We can't help you with that.
But - we can show you how to type in multiple places at once in RStudio! 😮
Useful when you need to make the same edit across your code but Find + Replace isn't suitable.
Want to be in multiple places at once over the holidays?
We can't help you with that.
But - we can show you how to type in multiple places at once in RStudio! 😮
Useful when you need to make the same edit across your code but Find + Replace isn't suitable.
🎄Day 15: Quiz answers!🎄
I have possibly learned to not post R quizzes on a Saturday.
Regardless! Here is why the two "ñ" characters were not the same: their underlying encoding was actually different!
I have possibly learned to not post R quizzes on a Saturday.
Regardless! Here is why the two "ñ" characters were not the same: their underlying encoding was actually different!
December 15, 2024 at 11:09 PM
🎄Day 15: Quiz answers!🎄
I have possibly learned to not post R quizzes on a Saturday.
Regardless! Here is why the two "ñ" characters were not the same: their underlying encoding was actually different!
I have possibly learned to not post R quizzes on a Saturday.
Regardless! Here is why the two "ñ" characters were not the same: their underlying encoding was actually different!
🎄Day 14: Quiz!🎄
Why do these two seemingly identical characters not equal each other in R?
Why do these two seemingly identical characters not equal each other in R?

December 15, 2024 at 2:17 AM
🎄Day 14: Quiz!🎄
Why do these two seemingly identical characters not equal each other in R?
Why do these two seemingly identical characters not equal each other in R?
🎄 Day 13: Sound alerts in R! 🎄
Ever find yourself waiting for code to finish running, only to forget and miss when it’s done? Try {beepr}!
🔔Add beep() to the end of your code, and it will ping when done
🎺Prefer a celebratory trumpet sound? Add beep("fanfare") instead!
Enjoy!
Ever find yourself waiting for code to finish running, only to forget and miss when it’s done? Try {beepr}!
🔔Add beep() to the end of your code, and it will ping when done
🎺Prefer a celebratory trumpet sound? Add beep("fanfare") instead!
Enjoy!
December 13, 2024 at 4:05 PM
🎄 Day 13: Sound alerts in R! 🎄
Ever find yourself waiting for code to finish running, only to forget and miss when it’s done? Try {beepr}!
🔔Add beep() to the end of your code, and it will ping when done
🎺Prefer a celebratory trumpet sound? Add beep("fanfare") instead!
Enjoy!
Ever find yourself waiting for code to finish running, only to forget and miss when it’s done? Try {beepr}!
🔔Add beep() to the end of your code, and it will ping when done
🎺Prefer a celebratory trumpet sound? Add beep("fanfare") instead!
Enjoy!
🎄Day 12: Assessing missing data🎄
Epis know well that missingness can skew analyses, so needs careful review. No fear, {naniar} can help! E.g.:
☑️pct_miss_case(): to check % of rows with NAs
☑️gg_miss_var(): to quickly visualize missingness by column
See more in Ch. 20 of the EpiRHandbook.com!
Epis know well that missingness can skew analyses, so needs careful review. No fear, {naniar} can help! E.g.:
☑️pct_miss_case(): to check % of rows with NAs
☑️gg_miss_var(): to quickly visualize missingness by column
See more in Ch. 20 of the EpiRHandbook.com!

December 12, 2024 at 10:07 PM
🎄Day 12: Assessing missing data🎄
Epis know well that missingness can skew analyses, so needs careful review. No fear, {naniar} can help! E.g.:
☑️pct_miss_case(): to check % of rows with NAs
☑️gg_miss_var(): to quickly visualize missingness by column
See more in Ch. 20 of the EpiRHandbook.com!
Epis know well that missingness can skew analyses, so needs careful review. No fear, {naniar} can help! E.g.:
☑️pct_miss_case(): to check % of rows with NAs
☑️gg_miss_var(): to quickly visualize missingness by column
See more in Ch. 20 of the EpiRHandbook.com!

Day 10: Code readability!
Are you making life harder for yourself in R? Or are you using rainbow parentheses and highlighted functions!?
Which one does your code look like?
Are you making life harder for yourself in R? Or are you using rainbow parentheses and highlighted functions!?
Which one does your code look like?

December 10, 2024 at 4:30 PM
Day 10: Code readability!
Are you making life harder for yourself in R? Or are you using rainbow parentheses and highlighted functions!?
Which one does your code look like?
Are you making life harder for yourself in R? Or are you using rainbow parentheses and highlighted functions!?
Which one does your code look like?
Day 9: Where do the R version names come from?
Run R.version on your console to see your version number and name. The current one is 4.4.2: “Pile of Leaves”.
Internet chat suggests these names are all inspired by the Peanuts comic strip.
And sure enough…
#r #rstats #charliebrown #peanuts 🥜
Run R.version on your console to see your version number and name. The current one is 4.4.2: “Pile of Leaves”.
Internet chat suggests these names are all inspired by the Peanuts comic strip.
And sure enough…
#r #rstats #charliebrown #peanuts 🥜

December 9, 2024 at 12:57 PM
Day 9: Where do the R version names come from?
Run R.version on your console to see your version number and name. The current one is 4.4.2: “Pile of Leaves”.
Internet chat suggests these names are all inspired by the Peanuts comic strip.
And sure enough…
#r #rstats #charliebrown #peanuts 🥜
Run R.version on your console to see your version number and name. The current one is 4.4.2: “Pile of Leaves”.
Internet chat suggests these names are all inspired by the Peanuts comic strip.
And sure enough…
#r #rstats #charliebrown #peanuts 🥜
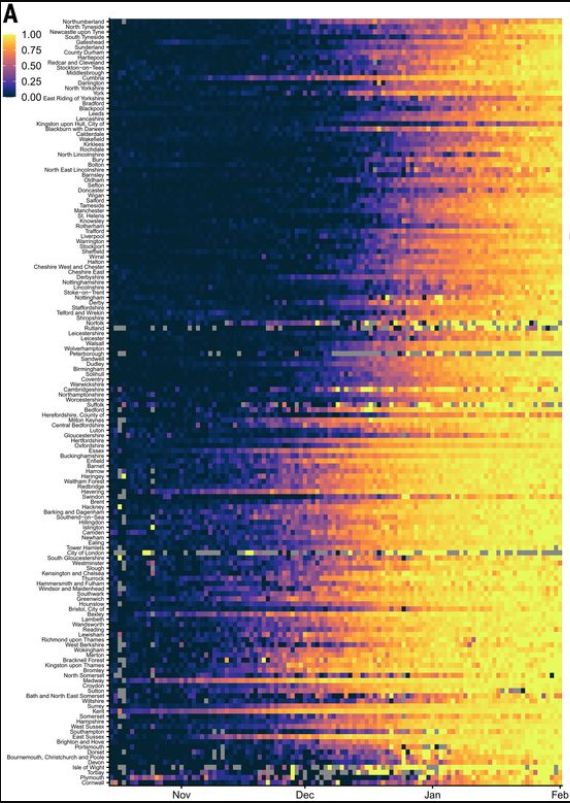
Day 8: Heatmaps! Epicurves are great when you have a few areas. But for dozens or hundreds of categories, if you want to see patterns then heatmaps are the way to go!
epirhandbook.com/new_pages/he...
epirhandbook.com/new_pages/he...
December 8, 2024 at 4:07 PM
Day 8: Heatmaps! Epicurves are great when you have a few areas. But for dozens or hundreds of categories, if you want to see patterns then heatmaps are the way to go!
epirhandbook.com/new_pages/he...
epirhandbook.com/new_pages/he...