


Chuck Purvis
@charleypurvis.bsky.social
Retired regional transportation planner. #census #gis #progressive #SanFranciscoBayArea #ebicycling #hayward #eastbay #beer #wine #baseball
Data hobbyist. Political Geography. Progressive Politics. Urban Geography. Demographics. #AmericanCommunitySurvey
Data hobbyist. Political Geography. Progressive Politics. Urban Geography. Demographics. #AmericanCommunitySurvey
Excellent op-ed about expanding size of California State Assembly and State Senate.
Size of Calif state legislature has not changed in over 150 years!
www.sfchronicle.com/opinion/open...
Size of Calif state legislature has not changed in over 150 years!
www.sfchronicle.com/opinion/open...

California doesn’t need to be broken up. The Legislature needs more seats
OPINION: California’s problem isn’t that the state has become too big to govern. It’s that we need to add more legislative districts and representatives.
www.sfchronicle.com
December 30, 2025 at 7:45 PM
Excellent op-ed about expanding size of California State Assembly and State Senate.
Size of Calif state legislature has not changed in over 150 years!
www.sfchronicle.com/opinion/open...
Size of Calif state legislature has not changed in over 150 years!
www.sfchronicle.com/opinion/open...
#beer #craftbeer #UCDavis
Master Brewers alumni from UC Davis program reunite
edition.pagesuite.com/popovers/dyn...
Master Brewers alumni from UC Davis program reunite
edition.pagesuite.com/popovers/dyn...
Master Brewers alumni from UC Davis program reunite - East Bay Times
edition.pagesuite.com
December 28, 2025 at 6:41 PM
#beer #craftbeer #UCDavis
Master Brewers alumni from UC Davis program reunite
edition.pagesuite.com/popovers/dyn...
Master Brewers alumni from UC Davis program reunite
edition.pagesuite.com/popovers/dyn...
www.sfchronicle.com/projects/202...
Great data dive by SF Chronicle on Californians use of time using #ATUS via #iPUMS
American Time Use Survey.
Great data dive by SF Chronicle on Californians use of time using #ATUS via #iPUMS
American Time Use Survey.

California stereotypes are real — and this extremely detailed data about time use proves it
How do Californians use their time? This breakdown shows how many minutes are spent on activities daily.
www.sfchronicle.com
December 14, 2025 at 7:28 PM
www.sfchronicle.com/projects/202...
Great data dive by SF Chronicle on Californians use of time using #ATUS via #iPUMS
American Time Use Survey.
Great data dive by SF Chronicle on Californians use of time using #ATUS via #iPUMS
American Time Use Survey.
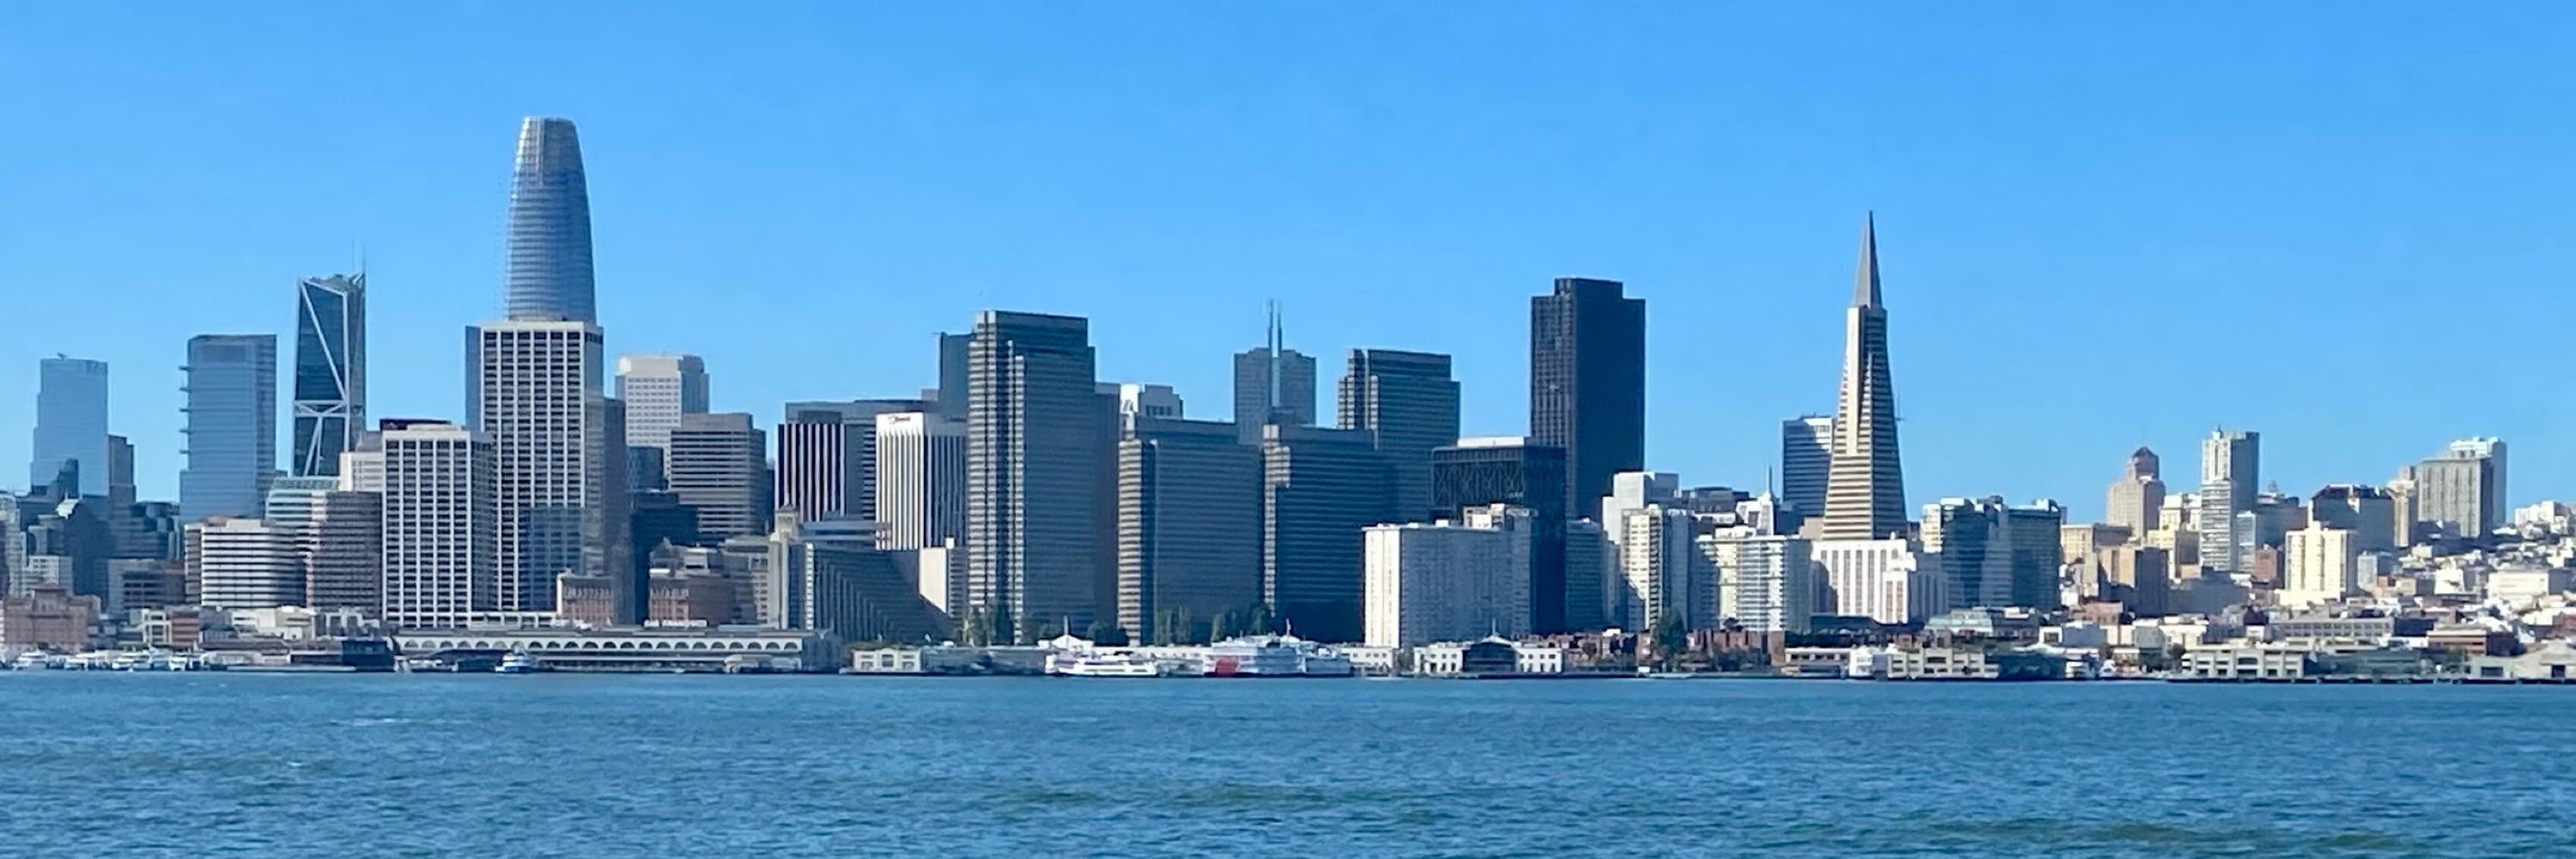
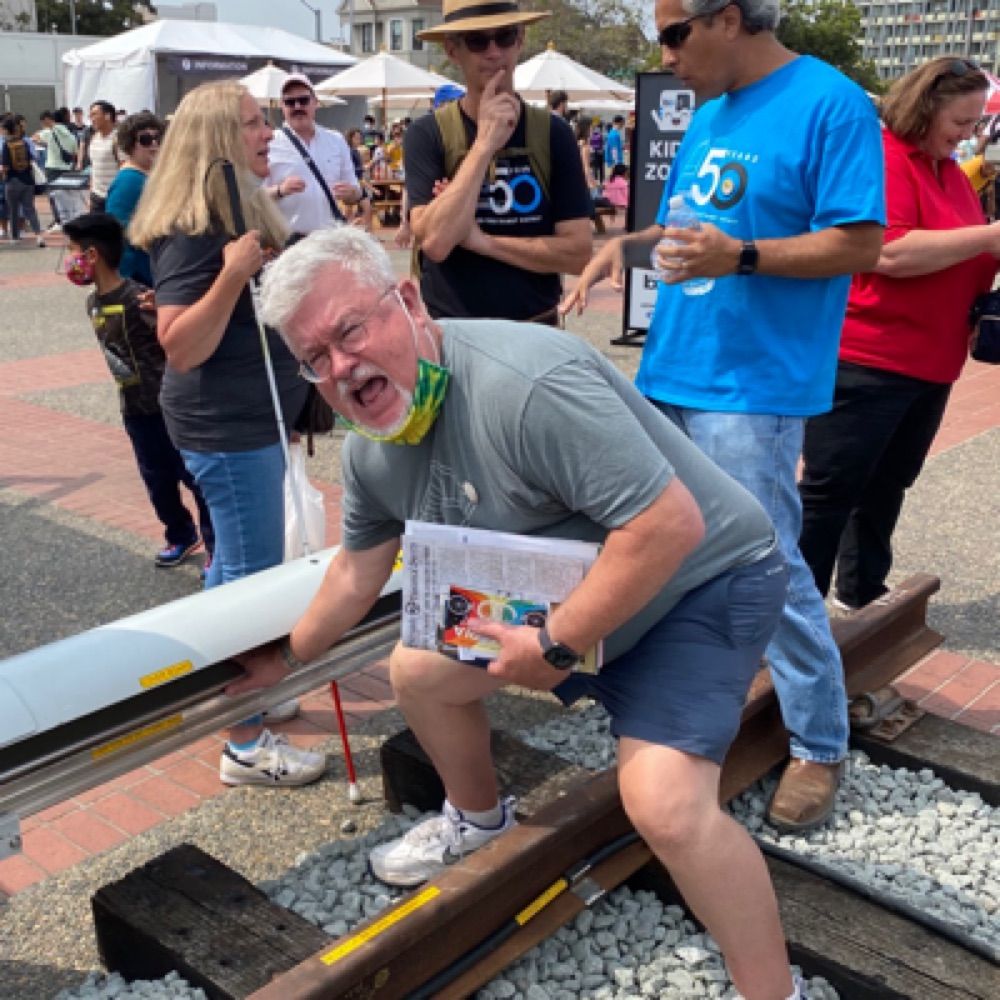
#Streetcars of desire. Great story by Nolte on historic streetcars in #SanFrancisco
www.sfchronicle.com/bayarea/arti...
www.sfchronicle.com/bayarea/arti...
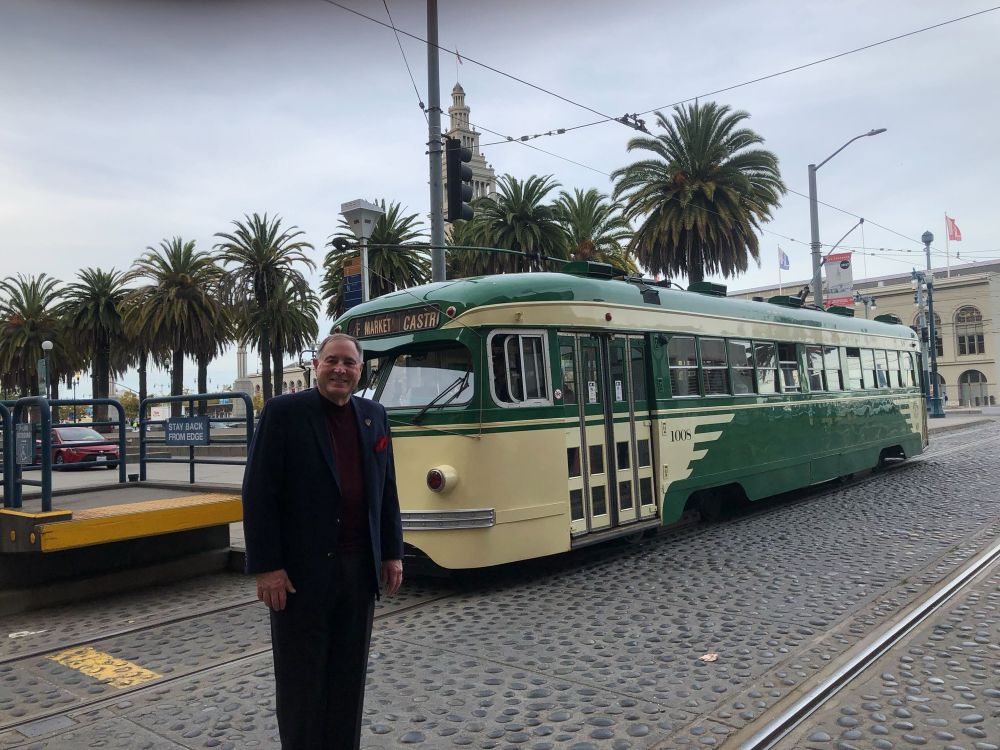
A ride on S.F.’s ‘iron monster’ as a boy sparked a lifelong dedication to city’s streetcars
The Market Street Railway is the preservation partner of the San Francisco Municipal Railway, acting as cheerleader, watchdog, lobbying group and support base for the city’s cable cars.
www.sfchronicle.com
December 6, 2025 at 7:15 PM
#Streetcars of desire. Great story by Nolte on historic streetcars in #SanFrancisco
www.sfchronicle.com/bayarea/arti...
www.sfchronicle.com/bayarea/arti...
This feels like a remake of the James Bond film “A View to the Kill”
#blimp #zeppelin
www.sfchronicle.com/bayarea/arti...
#blimp #zeppelin
www.sfchronicle.com/bayarea/arti...

Massive white blimp floating over San Francisco has ties to Google
Sergey Brin’s Pathfinder 1 airship completed another test flight over the Bay on Tuesday.
www.sfchronicle.com
November 18, 2025 at 7:40 PM
This feels like a remake of the James Bond film “A View to the Kill”
#blimp #zeppelin
www.sfchronicle.com/bayarea/arti...
#blimp #zeppelin
www.sfchronicle.com/bayarea/arti...
Fascinating op-ed re senior citizens and #waymo driverless autos.
www.sfchronicle.com/opinion/open...
www.sfchronicle.com/opinion/open...
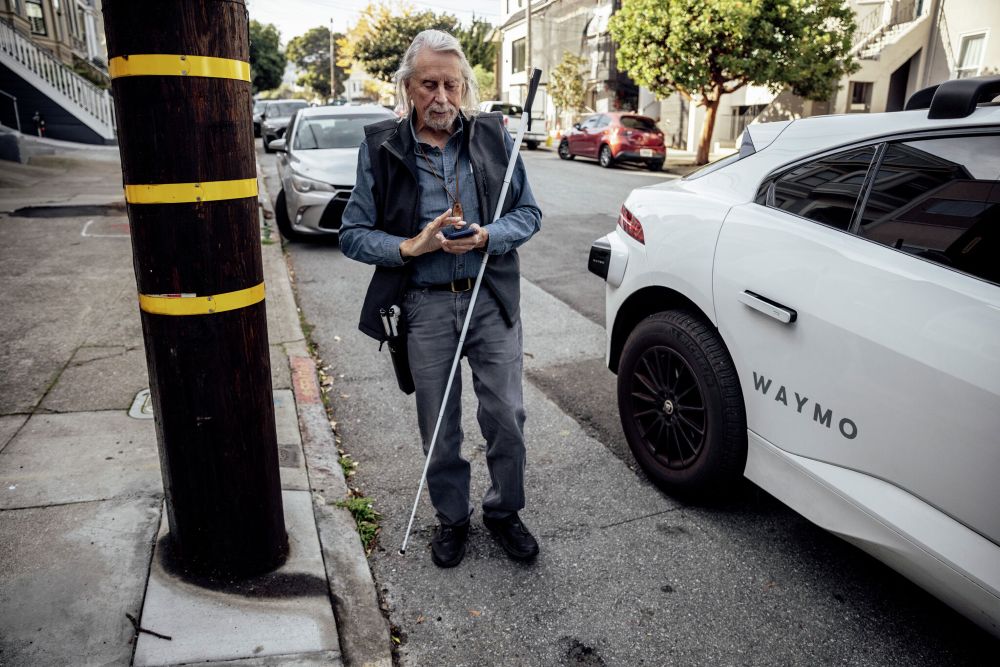
For Bay Area seniors, Waymo and self-driving cars are the future
OPINION: “The autonomous car is a wellness antidote: It lets older people continue to partake in normal routines and recapture the thrill of spontaneity,” Jane Gould writes.
www.sfchronicle.com
November 18, 2025 at 7:35 PM
Fascinating op-ed re senior citizens and #waymo driverless autos.
www.sfchronicle.com/opinion/open...
www.sfchronicle.com/opinion/open...
Bad news for #Hayward with loan default for the Maple & Main development in downtown Hayward.
Housing project falls into default
edition.pagesuite.com/popovers/dyn...
Housing project falls into default
edition.pagesuite.com/popovers/dyn...
Housing project falls into default - East Bay Times
edition.pagesuite.com
November 17, 2025 at 5:24 PM
Bad news for #Hayward with loan default for the Maple & Main development in downtown Hayward.
Housing project falls into default
edition.pagesuite.com/popovers/dyn...
Housing project falls into default
edition.pagesuite.com/popovers/dyn...
#craftbeer
Great Jay Brooks story on new / reopened craft breweries:
Rockaway Beach Brewery in Pacifica, 50 Vara brewery in the Sunset, and Magnolia in the Haight. Can’t wait to visit!!
THEY’RE BACK!
edition.pagesuite.com/popovers/dyn...
Great Jay Brooks story on new / reopened craft breweries:
Rockaway Beach Brewery in Pacifica, 50 Vara brewery in the Sunset, and Magnolia in the Haight. Can’t wait to visit!!
THEY’RE BACK!
edition.pagesuite.com/popovers/dyn...
THEY’RE BACK! - East Bay Times
edition.pagesuite.com
November 16, 2025 at 6:12 PM
#craftbeer
Great Jay Brooks story on new / reopened craft breweries:
Rockaway Beach Brewery in Pacifica, 50 Vara brewery in the Sunset, and Magnolia in the Haight. Can’t wait to visit!!
THEY’RE BACK!
edition.pagesuite.com/popovers/dyn...
Great Jay Brooks story on new / reopened craft breweries:
Rockaway Beach Brewery in Pacifica, 50 Vara brewery in the Sunset, and Magnolia in the Haight. Can’t wait to visit!!
THEY’RE BACK!
edition.pagesuite.com/popovers/dyn...
Americans Without Health Insurance (Part 5) PUMAs
1/4
#Census #ACS #AmericanCommunitySurvey #ACA #Obamacare
Continuing my analysis of the health uninsured in 2024.
PUMAs are Public Use Microdata Areas. They are essentially "regional analysis districts" with a population of 100,000+ persons.
Americans Without Health Insurance (Part 5) PUMAs
1/4
#Census #ACS #AmericanCommunitySurvey #ACA #Obamacare
Continuing my analysis of the health uninsured in 2024.
PUMAs are Public Use Microdata Areas. They are essentially "regional analysis districts" with a population of 100,000+ persons.


November 5, 2025 at 6:14 PM
Americans Without Health Insurance (Part 5) PUMAs
1/4
#Census #ACS #AmericanCommunitySurvey #ACA #Obamacare
Continuing my analysis of the health uninsured in 2024.
PUMAs are Public Use Microdata Areas. They are essentially "regional analysis districts" with a population of 100,000+ persons.
Americans Without Health Insurance (Part 5) PUMAs
1/4
#Census #ACS #AmericanCommunitySurvey #ACA #Obamacare
Continuing my analysis of the health uninsured in 2024.
PUMAs are Public Use Microdata Areas. They are essentially "regional analysis districts" with a population of 100,000+ persons.
I saw this East Bay Times article on the East Bay Times app and thought you’d be interested.
I remember old Harry at the Temescal Kaspers.
And I miss my Casper’s in downtown #Hayward, too 🌭🌭
Kasper’s, the hot dog that ‘started it all’ in Oakland, is no more
edition.pagesuite.com/popovers/dyn...
I remember old Harry at the Temescal Kaspers.
And I miss my Casper’s in downtown #Hayward, too 🌭🌭
Kasper’s, the hot dog that ‘started it all’ in Oakland, is no more
edition.pagesuite.com/popovers/dyn...

November 2, 2025 at 5:20 PM
I saw this East Bay Times article on the East Bay Times app and thought you’d be interested.
I remember old Harry at the Temescal Kaspers.
And I miss my Casper’s in downtown #Hayward, too 🌭🌭
Kasper’s, the hot dog that ‘started it all’ in Oakland, is no more
edition.pagesuite.com/popovers/dyn...
I remember old Harry at the Temescal Kaspers.
And I miss my Casper’s in downtown #Hayward, too 🌭🌭
Kasper’s, the hot dog that ‘started it all’ in Oakland, is no more
edition.pagesuite.com/popovers/dyn...
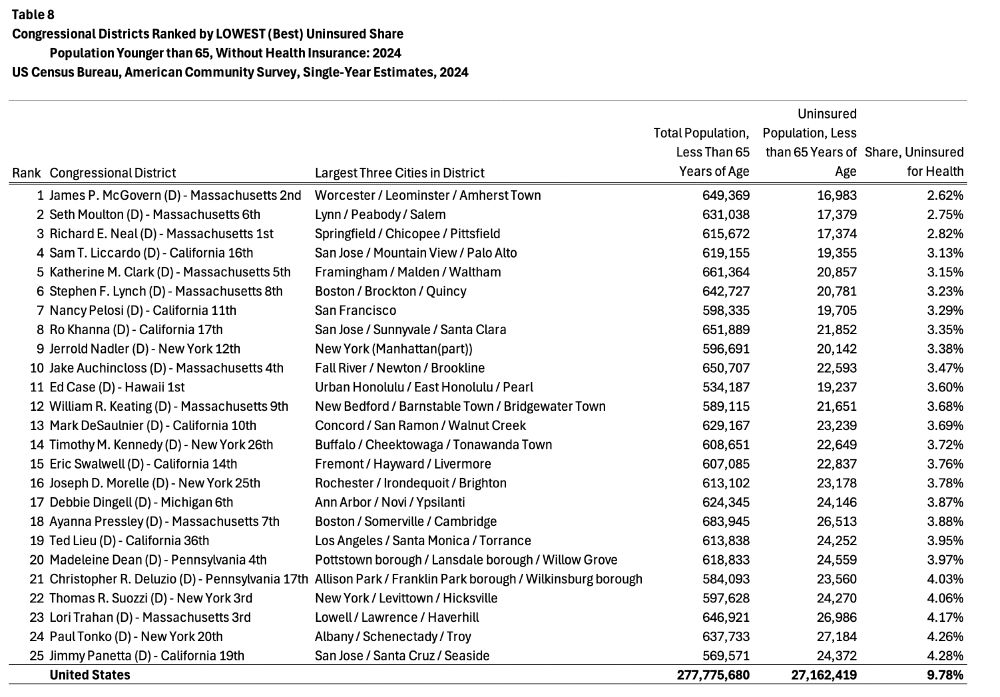
Americans Without Health Insurance (Part 4) CONGRESSIONAL DISTRICTS
1/3
#Census #ACS #AmericanCommunitySurvey #ACA #Obamacare
Continuing my analysis of the health uninsured in 2024.
Table 7. Worst CDs with highest uninsured shares
Table 8. Best CDs with lowest uninsured shares
1/3
#Census #ACS #AmericanCommunitySurvey #ACA #Obamacare
Continuing my analysis of the health uninsured in 2024.
Table 7. Worst CDs with highest uninsured shares
Table 8. Best CDs with lowest uninsured shares


October 29, 2025 at 6:17 PM
Americans Without Health Insurance (Part 4) CONGRESSIONAL DISTRICTS
1/3
#Census #ACS #AmericanCommunitySurvey #ACA #Obamacare
Continuing my analysis of the health uninsured in 2024.
Table 7. Worst CDs with highest uninsured shares
Table 8. Best CDs with lowest uninsured shares
1/3
#Census #ACS #AmericanCommunitySurvey #ACA #Obamacare
Continuing my analysis of the health uninsured in 2024.
Table 7. Worst CDs with highest uninsured shares
Table 8. Best CDs with lowest uninsured shares
www.sfchronicle.com/bayarea/arti...
Great article on the acquisition of indie bookseller Books, Inc by Barnes and Noble. #books #indiebooks
Great article on the acquisition of indie bookseller Books, Inc by Barnes and Noble. #books #indiebooks

Bay Area booksellers fear losing business as chains buy indie stores, keep their old names
The Bay Area’s tight-knit independent booksellers fear for their future as chains such as Barnes & Noble buy local stores and maintain the indie vibe.
www.sfchronicle.com
October 27, 2025 at 6:48 PM
www.sfchronicle.com/bayarea/arti...
Great article on the acquisition of indie bookseller Books, Inc by Barnes and Noble. #books #indiebooks
Great article on the acquisition of indie bookseller Books, Inc by Barnes and Noble. #books #indiebooks
Americans Without Health Insurance (Part 3) CITIES
1/4
#Census #ACS #AmericanCommunitySurvey #ACA #Obamacare
Continuing my analysis of the health uninsured in 2024.
Table 4. Best places with lowest uninsured shares
Table 5. Worst places with highest uninsured shares
Table 6. Largest US places
1/4
#Census #ACS #AmericanCommunitySurvey #ACA #Obamacare
Continuing my analysis of the health uninsured in 2024.
Table 4. Best places with lowest uninsured shares
Table 5. Worst places with highest uninsured shares
Table 6. Largest US places


October 15, 2025 at 9:28 PM
Americans Without Health Insurance (Part 3) CITIES
1/4
#Census #ACS #AmericanCommunitySurvey #ACA #Obamacare
Continuing my analysis of the health uninsured in 2024.
Table 4. Best places with lowest uninsured shares
Table 5. Worst places with highest uninsured shares
Table 6. Largest US places
1/4
#Census #ACS #AmericanCommunitySurvey #ACA #Obamacare
Continuing my analysis of the health uninsured in 2024.
Table 4. Best places with lowest uninsured shares
Table 5. Worst places with highest uninsured shares
Table 6. Largest US places
Americans Without Health Insurance (Part 2) 1/3
#Census #ACS #AmericanCommunitySurvey #ACA #Obamacare
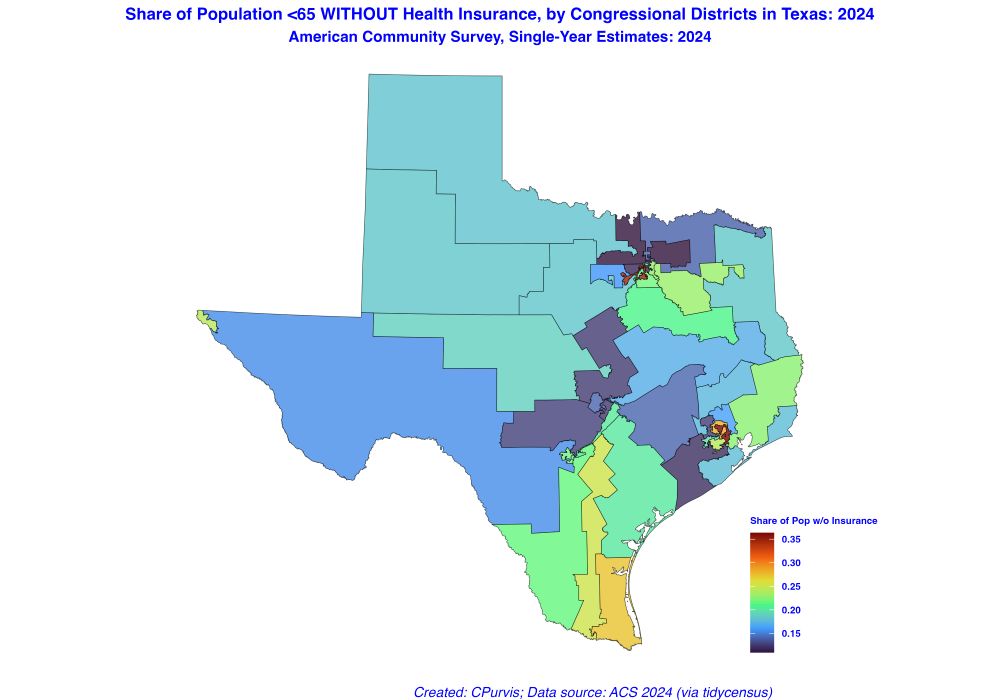
Texas is the #1 (Worst) US State in 2024 in terms of share of persons under 65 WITHOUT Health Insurance: 19.2%.
Texas was also the #1 US State in 2009, at 26.3% uninsured, persons age < 65.
Americans Without Health Insurance (Part 2) 1/3
#Census #ACS #AmericanCommunitySurvey #ACA #Obamacare
Texas is the #1 (Worst) US State in 2024 in terms of share of persons under 65 WITHOUT Health Insurance: 19.2%.
Texas was also the #1 US State in 2009, at 26.3% uninsured, persons age < 65.


October 14, 2025 at 6:40 PM
Americans Without Health Insurance (Part 2) 1/3
#Census #ACS #AmericanCommunitySurvey #ACA #Obamacare
Texas is the #1 (Worst) US State in 2024 in terms of share of persons under 65 WITHOUT Health Insurance: 19.2%.
Texas was also the #1 US State in 2009, at 26.3% uninsured, persons age < 65.
Americans Without Health Insurance (Part 2) 1/3
#Census #ACS #AmericanCommunitySurvey #ACA #Obamacare
Texas is the #1 (Worst) US State in 2024 in terms of share of persons under 65 WITHOUT Health Insurance: 19.2%.
Texas was also the #1 US State in 2009, at 26.3% uninsured, persons age < 65.
Americans Without Health Insurance (Part 1) 1/5
#Census #ACS #AmericanCommunitySurvey #ACA #Obamacare
The Census Bureau's American Community Survey has collected on Health Insurance for individuals between 2008 and the present. This analysis examines uninsured shares of the population by age group
#Census #ACS #AmericanCommunitySurvey #ACA #Obamacare
The Census Bureau's American Community Survey has collected on Health Insurance for individuals between 2008 and the present. This analysis examines uninsured shares of the population by age group


October 13, 2025 at 8:44 PM
Americans Without Health Insurance (Part 1) 1/5
#Census #ACS #AmericanCommunitySurvey #ACA #Obamacare
The Census Bureau's American Community Survey has collected on Health Insurance for individuals between 2008 and the present. This analysis examines uninsured shares of the population by age group
#Census #ACS #AmericanCommunitySurvey #ACA #Obamacare
The Census Bureau's American Community Survey has collected on Health Insurance for individuals between 2008 and the present. This analysis examines uninsured shares of the population by age group
www.sfchronicle.com/opinion/open...
Good op-ed piece by urban planner Bill Fulton on pro-housing #SB79 #TOD #TransitOrientedDevelopment
Good op-ed piece by urban planner Bill Fulton on pro-housing #SB79 #TOD #TransitOrientedDevelopment

SB79 is now law. But California still has work to do to fix the housing crisis and meet its climate goals
OPINION: “This bet on housing near transit stations could not come at a worse time. Transit ridership is still below pre-pandemic highs — especially on the rail systems that SB79 focuses on.”
www.sfchronicle.com
October 11, 2025 at 5:44 PM
www.sfchronicle.com/opinion/open...
Good op-ed piece by urban planner Bill Fulton on pro-housing #SB79 #TOD #TransitOrientedDevelopment
Good op-ed piece by urban planner Bill Fulton on pro-housing #SB79 #TOD #TransitOrientedDevelopment
www.sfchronicle.com/politics/art...
Good news for housing advocates
#SB79 signed by Gov Newsom. #YIMBY #TOD #TransitOrirntedDevelopment
Good news for housing advocates
#SB79 signed by Gov Newsom. #YIMBY #TOD #TransitOrirntedDevelopment

New California law would put taller apartment buildings near BART and Caltrain
Gov. Gavin Newsom on Friday signed Senate Bill 79 to put dense housing around transit hubs.
www.sfchronicle.com
October 10, 2025 at 6:09 PM
www.sfchronicle.com/politics/art...
Good news for housing advocates
#SB79 signed by Gov Newsom. #YIMBY #TOD #TransitOrirntedDevelopment
Good news for housing advocates
#SB79 signed by Gov Newsom. #YIMBY #TOD #TransitOrirntedDevelopment
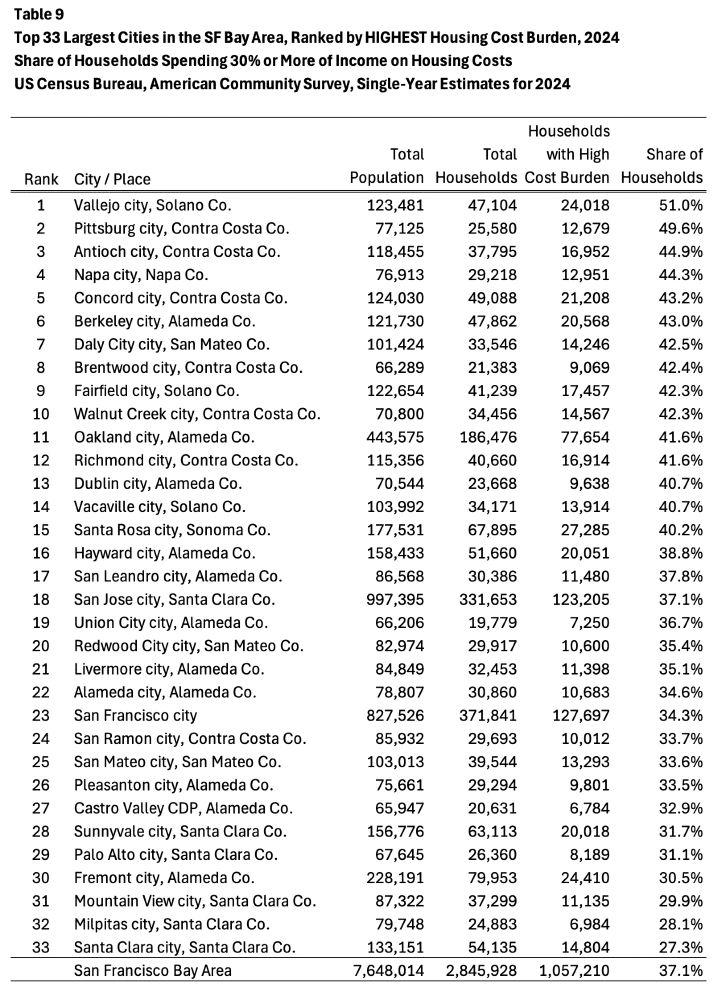
Gimme (Affordable) Shelter, Part 5. Large Cities in California and the Bay Area
#census #ACS #affordability
Continuing analysis of the 2024 share of households with high or severe (30%+) housing cost burdens.
Most cost burdened large city in California? Inglewood at 56.9% of HHs, costs >= 30.0%
#census #ACS #affordability
Continuing analysis of the 2024 share of households with high or severe (30%+) housing cost burdens.
Most cost burdened large city in California? Inglewood at 56.9% of HHs, costs >= 30.0%

October 8, 2025 at 6:59 PM
Gimme (Affordable) Shelter, Part 5. Large Cities in California and the Bay Area
#census #ACS #affordability
Continuing analysis of the 2024 share of households with high or severe (30%+) housing cost burdens.
Most cost burdened large city in California? Inglewood at 56.9% of HHs, costs >= 30.0%
#census #ACS #affordability
Continuing analysis of the 2024 share of households with high or severe (30%+) housing cost burdens.
Most cost burdened large city in California? Inglewood at 56.9% of HHs, costs >= 30.0%
Columnist Jonathan Lansler’s article on mortgage free households in California
#census #ACS #AmericanCommunitySurvey
Californians free from home loans on the rise
edition.pagesuite.com/popovers/dyn...
#census #ACS #AmericanCommunitySurvey
Californians free from home loans on the rise
edition.pagesuite.com/popovers/dyn...
Californians free from home loans on the rise - East Bay Times
edition.pagesuite.com
October 5, 2025 at 6:04 PM
Columnist Jonathan Lansler’s article on mortgage free households in California
#census #ACS #AmericanCommunitySurvey
Californians free from home loans on the rise
edition.pagesuite.com/popovers/dyn...
#census #ACS #AmericanCommunitySurvey
Californians free from home loans on the rise
edition.pagesuite.com/popovers/dyn...
Reposted by Chuck Purvis

Congressional District Interactive Map: How Much Will ACA Premium Payments Rise if Enhanced Subsidies Expire? | KFF www.kff.org/affordable-c...

Congressional District Interactive Map: How Much Will ACA Premium Payments Rise if Enhanced Subsidies Expire? | KFF
This analysis and interactive map illustrate how much more enrollees in Affordable Care Act (ACA) Marketplace plans would pay in premiums at the congressional district level if the enhanced subsidies ...
www.kff.org
October 4, 2025 at 6:43 PM
Congressional District Interactive Map: How Much Will ACA Premium Payments Rise if Enhanced Subsidies Expire? | KFF www.kff.org/affordable-c...


www.sfchronicle.com/bayarea/arti...
Great article by S.F. Chronicle
#YIMBY #TransitOrientedDevelopment #SB79
Great article by S.F. Chronicle
#YIMBY #TransitOrientedDevelopment #SB79

Will this YIMBY bill put more homes near transit? Our map shows where housing could be built
Housing advocates who viewed SB79 as a potential sea change say it became diluted during the political process. The bill’s primary sponsor calls it a “a remarkably strong bill.”
www.sfchronicle.com
October 3, 2025 at 5:51 PM
www.sfchronicle.com/bayarea/arti...
Great article by S.F. Chronicle
#YIMBY #TransitOrientedDevelopment #SB79
Great article by S.F. Chronicle
#YIMBY #TransitOrientedDevelopment #SB79
Most Bay Area renters are ‘cost-burdened’ — especially in these areas
#census #ACS #AmericanCommunitySurvey #affordability
www.sfchronicle.com/realestate/a...
#census #ACS #AmericanCommunitySurvey #affordability
www.sfchronicle.com/realestate/a...

Most Bay Area renters are ‘cost-burdened’ — especially in these areas
Rising housing costs and soft income growth in the outer Bay Area has made it harder for renters to make ends meet.
www.sfchronicle.com
September 30, 2025 at 5:35 PM
Most Bay Area renters are ‘cost-burdened’ — especially in these areas
#census #ACS #AmericanCommunitySurvey #affordability
www.sfchronicle.com/realestate/a...
#census #ACS #AmericanCommunitySurvey #affordability
www.sfchronicle.com/realestate/a...
Reposted by Chuck Purvis
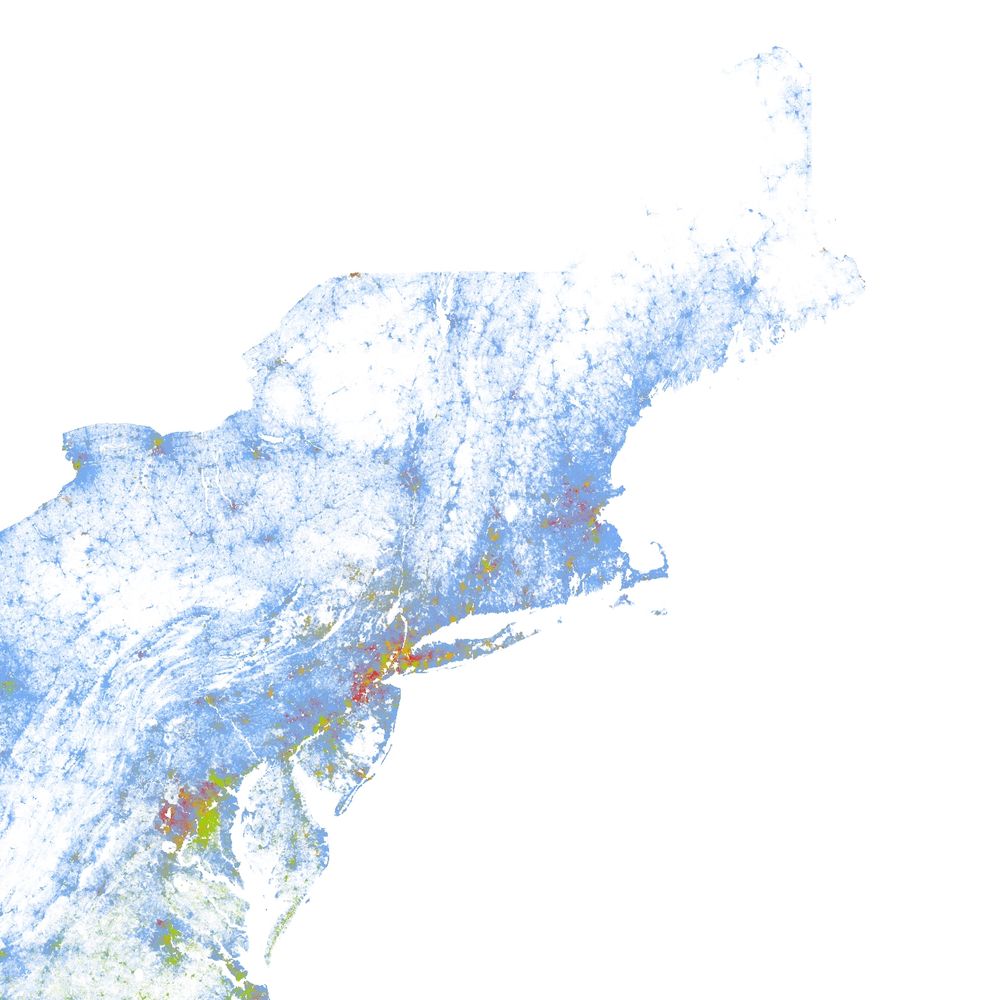
A dot map of Sunnyvale, CA's population by race, created using data from the 2020 US Census.
🔵 = White, 🟢 = Black, 🟠 = Hispanic, 🔴 = Asian, 🟤 = Native American/Other, 🟣 = Multiracial
Explore the map: https://www.censusdots.com/race/sunnyvale-ca-demographics?src=bluesky
🔵 = White, 🟢 = Black, 🟠 = Hispanic, 🔴 = Asian, 🟤 = Native American/Other, 🟣 = Multiracial
Explore the map: https://www.censusdots.com/race/sunnyvale-ca-demographics?src=bluesky

September 27, 2025 at 6:01 PM
A dot map of Sunnyvale, CA's population by race, created using data from the 2020 US Census.
🔵 = White, 🟢 = Black, 🟠 = Hispanic, 🔴 = Asian, 🟤 = Native American/Other, 🟣 = Multiracial
Explore the map: https://www.censusdots.com/race/sunnyvale-ca-demographics?src=bluesky
🔵 = White, 🟢 = Black, 🟠 = Hispanic, 🔴 = Asian, 🟤 = Native American/Other, 🟣 = Multiracial
Explore the map: https://www.censusdots.com/race/sunnyvale-ca-demographics?src=bluesky