Exploring
#data has become a creative way to make sense of the world around us—especially when it intersects with topics we already love, like movies and culture.
In our latest project, we turn to
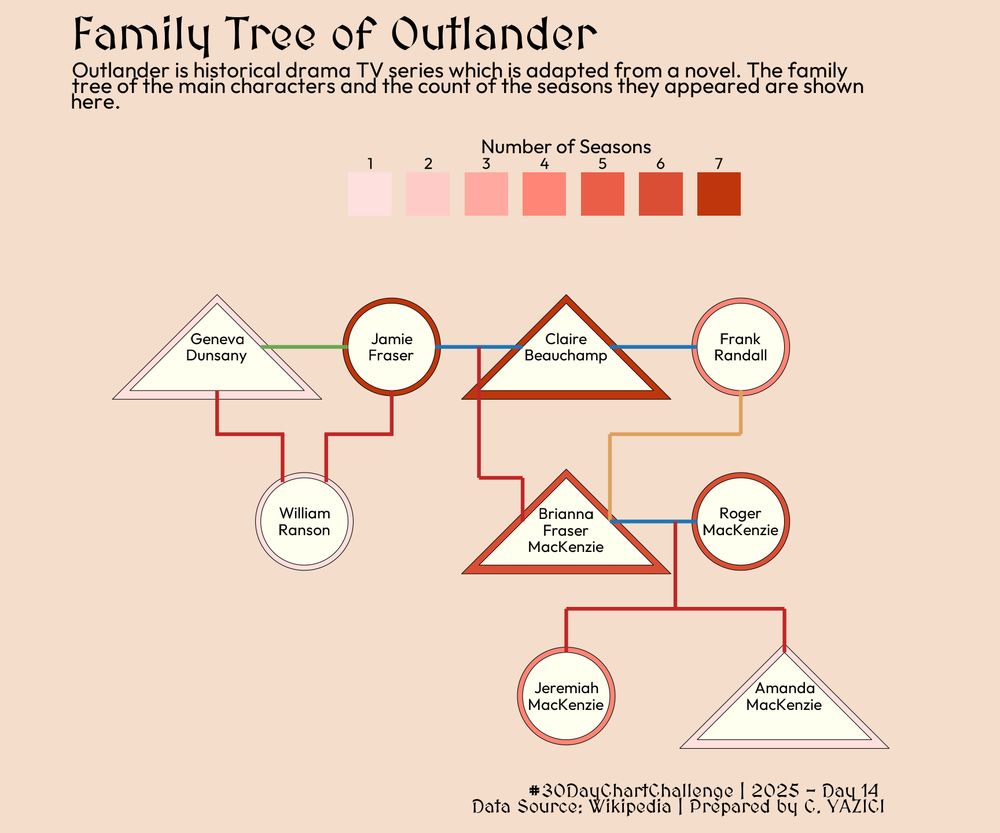
#movies.
medium.com/@statstostor...All feedback is welcome.
More data stories coming soon!