


Data for Progress
@dataforprogress.org
Data movements trust. Progressive policy and polling organization.
dataforprogress.org
dataforprogress.org
Pinned
Data for Progress
@dataforprogress.org
· Oct 30
We are thrilled to announce that @rodonnell.bsky.social has been named the next executive director of Data for Progress!
Ryan is an expert in survey methodology with a long history in progressive and union politics — he has worked with DFP since 2019 to shape our electoral polling.
Ryan is an expert in survey methodology with a long history in progressive and union politics — he has worked with DFP since 2019 to shape our electoral polling.
Voters do not agree with Trump that the economy is “A+++++.”

January 7, 2026 at 4:36 PM
Voters do not agree with Trump that the economy is “A+++++.”
NEW with @careinaction.bsky.social:
In Republican-held swing districts, a generic Democrat performs better once voters learn that their representative voted against extending ACA subsidies.
www.dataforprogress.org/blog/2025/12...
In Republican-held swing districts, a generic Democrat performs better once voters learn that their representative voted against extending ACA subsidies.
www.dataforprogress.org/blog/2025/12...

December 17, 2025 at 2:45 PM
NEW with @careinaction.bsky.social:
In Republican-held swing districts, a generic Democrat performs better once voters learn that their representative voted against extending ACA subsidies.
www.dataforprogress.org/blog/2025/12...
In Republican-held swing districts, a generic Democrat performs better once voters learn that their representative voted against extending ACA subsidies.
www.dataforprogress.org/blog/2025/12...
An overwhelming majority of voters (86%) say it is important that actions taken by the U.S. in international waters comply with international law and treaty agreements.
www.dataforprogress.org/blog/2025/12...
www.dataforprogress.org/blog/2025/12...

December 15, 2025 at 8:07 PM
An overwhelming majority of voters (86%) say it is important that actions taken by the U.S. in international waters comply with international law and treaty agreements.
www.dataforprogress.org/blog/2025/12...
www.dataforprogress.org/blog/2025/12...
NEW: By a -10-point margin, voters do not believe the boat strikes in the Caribbean are an effective way to reduce drug trafficking.
www.dataforprogress.org/blog/2025/12...
www.dataforprogress.org/blog/2025/12...

December 15, 2025 at 3:55 PM
NEW: By a -10-point margin, voters do not believe the boat strikes in the Caribbean are an effective way to reduce drug trafficking.
www.dataforprogress.org/blog/2025/12...
www.dataforprogress.org/blog/2025/12...
NEW: A majority of voters think that Trump will try to restrict various types of speech.
But in each case, a minority of voters actually want that speech to be restricted.
But in each case, a minority of voters actually want that speech to be restricted.

December 11, 2025 at 7:51 PM
NEW: A majority of voters think that Trump will try to restrict various types of speech.
But in each case, a minority of voters actually want that speech to be restricted.
But in each case, a minority of voters actually want that speech to be restricted.
NEW: Today, the Senate is set to vote on extending the Affordable Care Act's premium tax credits
Although the vote is expected to fail, 69% of voters support extending these tax credits.
www.dataforprogress.org/datasets/pol...
Although the vote is expected to fail, 69% of voters support extending these tax credits.
www.dataforprogress.org/datasets/pol...

December 11, 2025 at 4:27 PM
NEW: Today, the Senate is set to vote on extending the Affordable Care Act's premium tax credits
Although the vote is expected to fail, 69% of voters support extending these tax credits.
www.dataforprogress.org/datasets/pol...
Although the vote is expected to fail, 69% of voters support extending these tax credits.
www.dataforprogress.org/datasets/pol...
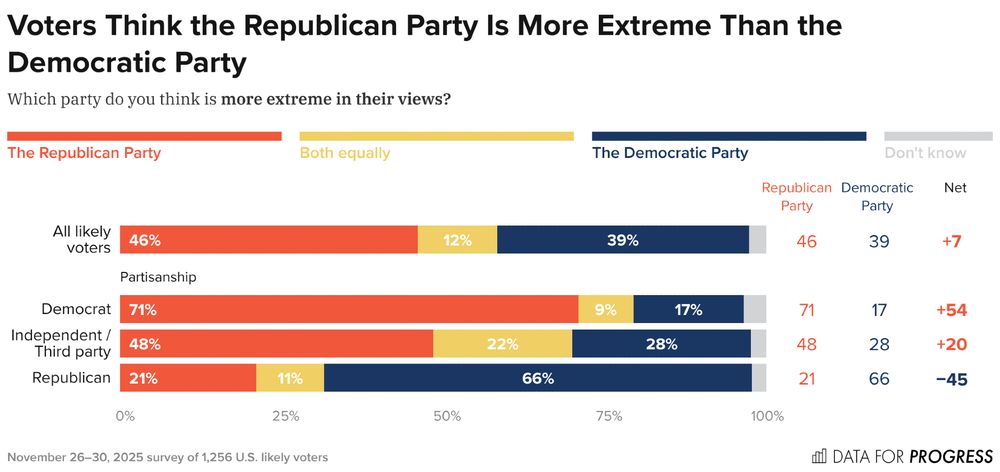
NEW: A plurality of voters view the Republican Party as more extreme than the Democratic Party — including Independents by a +20-point margin.
December 3, 2025 at 5:11 PM
NEW: A plurality of voters view the Republican Party as more extreme than the Democratic Party — including Independents by a +20-point margin.
We work tirelessly to deliver accurate polling data that builds the progressive movement and lays out a clear, inspiring vision for our country's future.
We'd be *extremely* grateful if you could support us this Giving Tuesday.
Support us today:
secure.actblue.com/donate/data-...
We'd be *extremely* grateful if you could support us this Giving Tuesday.
Support us today:
secure.actblue.com/donate/data-...
NEW: A majority of voters (63%) support a Medicare for All system that would:
- Eliminate most private insurance plans
- Replace premiums with higher taxes
- Guarantee health coverage for everyone
- Eliminate most out-of-pocket costs like copays and deductibles
- Eliminate most private insurance plans
- Replace premiums with higher taxes
- Guarantee health coverage for everyone
- Eliminate most out-of-pocket costs like copays and deductibles

December 2, 2025 at 7:09 PM
We work tirelessly to deliver accurate polling data that builds the progressive movement and lays out a clear, inspiring vision for our country's future.
We'd be *extremely* grateful if you could support us this Giving Tuesday.
Support us today:
secure.actblue.com/donate/data-...
We'd be *extremely* grateful if you could support us this Giving Tuesday.
Support us today:
secure.actblue.com/donate/data-...
Had a delayed flight over the holidays?
This year, the Trump administration withdrew a plan to require compensation for delays caused by the airline.
But 85% of voters think passengers should receive refunds for these delays.
www.dataforprogress.org/datasets/pol...
This year, the Trump administration withdrew a plan to require compensation for delays caused by the airline.
But 85% of voters think passengers should receive refunds for these delays.
www.dataforprogress.org/datasets/pol...

December 1, 2025 at 6:39 PM
Had a delayed flight over the holidays?
This year, the Trump administration withdrew a plan to require compensation for delays caused by the airline.
But 85% of voters think passengers should receive refunds for these delays.
www.dataforprogress.org/datasets/pol...
This year, the Trump administration withdrew a plan to require compensation for delays caused by the airline.
But 85% of voters think passengers should receive refunds for these delays.
www.dataforprogress.org/datasets/pol...
NEW: A majority of voters (63%) support a Medicare for All system that would:
- Eliminate most private insurance plans
- Replace premiums with higher taxes
- Guarantee health coverage for everyone
- Eliminate most out-of-pocket costs like copays and deductibles
- Eliminate most private insurance plans
- Replace premiums with higher taxes
- Guarantee health coverage for everyone
- Eliminate most out-of-pocket costs like copays and deductibles
November 26, 2025 at 8:12 PM
NEW: A majority of voters (63%) support a Medicare for All system that would:
- Eliminate most private insurance plans
- Replace premiums with higher taxes
- Guarantee health coverage for everyone
- Eliminate most out-of-pocket costs like copays and deductibles
- Eliminate most private insurance plans
- Replace premiums with higher taxes
- Guarantee health coverage for everyone
- Eliminate most out-of-pocket costs like copays and deductibles
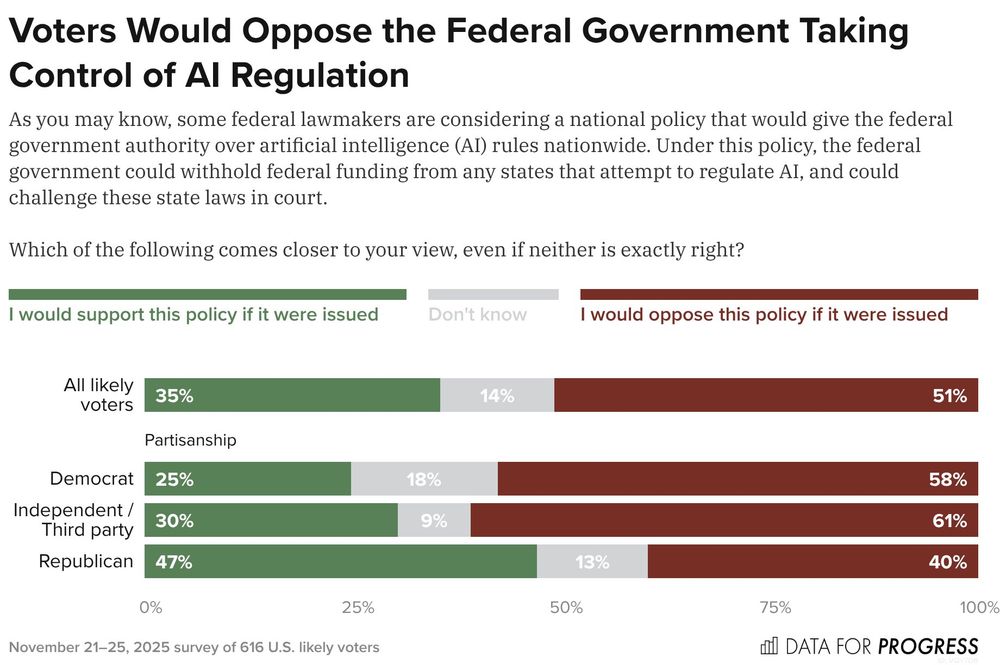
NEW: A majority of voters oppose giving the federal government authority over AI regulation and withholding funding from states that attempt to regulate AI.
www.dataforprogress.org/datasets/pol...
www.dataforprogress.org/datasets/pol...
November 25, 2025 at 8:37 PM
NEW: A majority of voters oppose giving the federal government authority over AI regulation and withholding funding from states that attempt to regulate AI.
www.dataforprogress.org/datasets/pol...
www.dataforprogress.org/datasets/pol...
NEW: A strong majority (65%) of voters prefer that the United States takes ambitious action on climate change, even if other countries do not.

November 21, 2025 at 3:51 PM
NEW: A strong majority (65%) of voters prefer that the United States takes ambitious action on climate change, even if other countries do not.
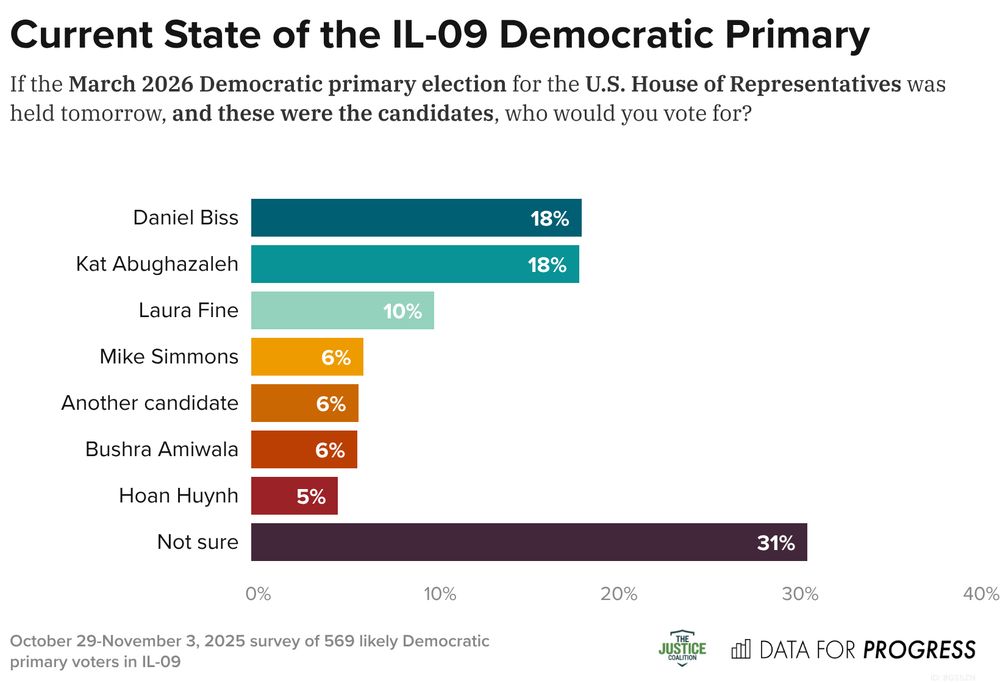
NEW IL-09 poll with the Justice Coalition Action: Daniel Biss and Kat Abughazaleh are tied for first in the Democratic primary with 18% of the vote.
Laura Fine trails in third with 10%, and all other candidates receive 6% or less of the vote.
Laura Fine trails in third with 10%, and all other candidates receive 6% or less of the vote.
November 20, 2025 at 9:03 PM
NEW IL-09 poll with the Justice Coalition Action: Daniel Biss and Kat Abughazaleh are tied for first in the Democratic primary with 18% of the vote.
Laura Fine trails in third with 10%, and all other candidates receive 6% or less of the vote.
Laura Fine trails in third with 10%, and all other candidates receive 6% or less of the vote.
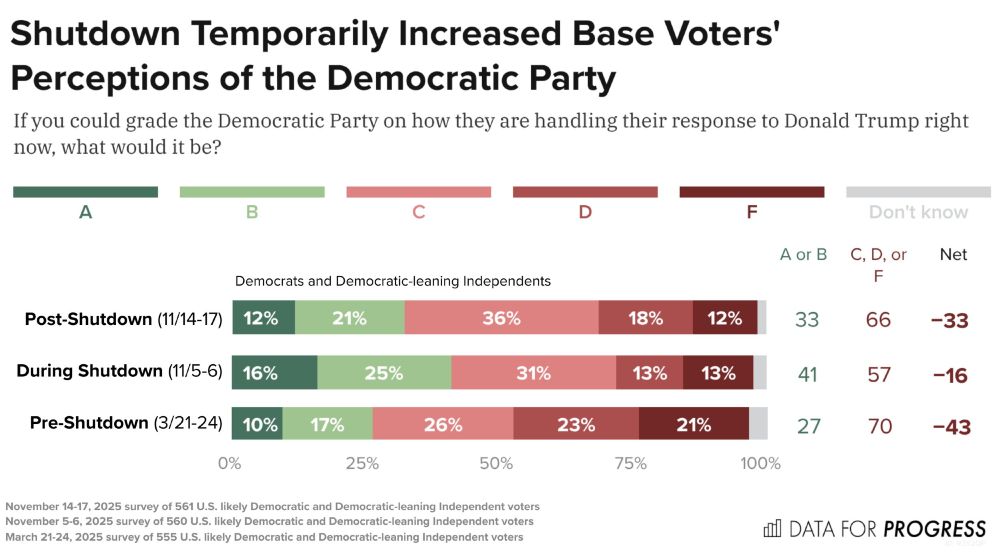
NEW: The government shutdown improved perceptions of the Democratic Party among its own voters.
Democratic voters rated the party higher during the shutdown than after the last funding fight in March.
However, their ratings declined slightly once the shutdown ended.
Democratic voters rated the party higher during the shutdown than after the last funding fight in March.
However, their ratings declined slightly once the shutdown ended.
November 20, 2025 at 7:31 PM
NEW: The government shutdown improved perceptions of the Democratic Party among its own voters.
Democratic voters rated the party higher during the shutdown than after the last funding fight in March.
However, their ratings declined slightly once the shutdown ended.
Democratic voters rated the party higher during the shutdown than after the last funding fight in March.
However, their ratings declined slightly once the shutdown ended.
NEW POLL: Voters agree that increased cryptocurrency uptake at the expense of traditional bank or credit union deposits will be harmful to local economies.
www.dataforprogress.org/blog/2025/11...
www.dataforprogress.org/blog/2025/11...

November 20, 2025 at 2:17 PM
NEW POLL: Voters agree that increased cryptocurrency uptake at the expense of traditional bank or credit union deposits will be harmful to local economies.
www.dataforprogress.org/blog/2025/11...
www.dataforprogress.org/blog/2025/11...
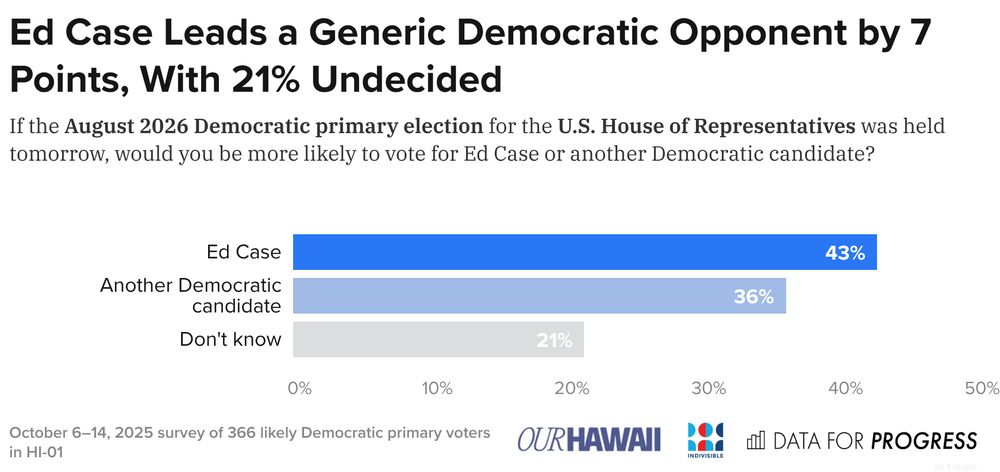
NEW HI-01 poll with @ourhawaii808.bsky.social and @indivisible.org:
Among likely Dem. primary voters, Rep. Ed Case leads against a generic opponent by 7 points, with 21% undecided.
While Case leads by 24 points against two named challengers, the race tightens if he faces only one opponent.
Among likely Dem. primary voters, Rep. Ed Case leads against a generic opponent by 7 points, with 21% undecided.
While Case leads by 24 points against two named challengers, the race tightens if he faces only one opponent.
November 17, 2025 at 9:24 PM
NEW HI-01 poll with @ourhawaii808.bsky.social and @indivisible.org:
Among likely Dem. primary voters, Rep. Ed Case leads against a generic opponent by 7 points, with 21% undecided.
While Case leads by 24 points against two named challengers, the race tightens if he faces only one opponent.
Among likely Dem. primary voters, Rep. Ed Case leads against a generic opponent by 7 points, with 21% undecided.
While Case leads by 24 points against two named challengers, the race tightens if he faces only one opponent.
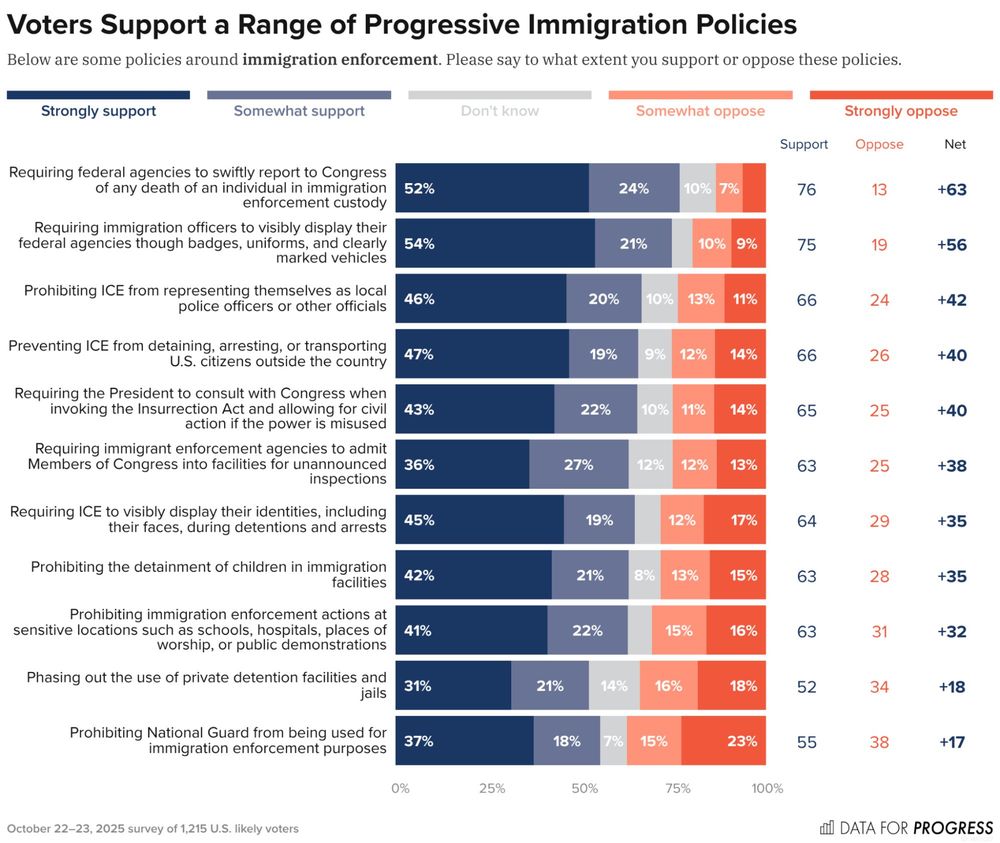
NEW: Voters support a variety of progressive immigration policies, including requiring officers to visibly display their identities and prohibiting the detainment of children in ICE facilities.
www.dataforprogress.org/blog/2025/11...
www.dataforprogress.org/blog/2025/11...
November 12, 2025 at 8:25 PM
NEW: Voters support a variety of progressive immigration policies, including requiring officers to visibly display their identities and prohibiting the detainment of children in ICE facilities.
www.dataforprogress.org/blog/2025/11...
www.dataforprogress.org/blog/2025/11...
NEW from @deluzio.house.gov:
It’s not just the rent that’s too damn high — it’s everything.
The American Dream isn’t real for a lot of hardworking people; it’s been ripped away.
Democrats must make the patriotic fight to restore the American Dream the beating heart of our party.
It’s not just the rent that’s too damn high — it’s everything.
The American Dream isn’t real for a lot of hardworking people; it’s been ripped away.
Democrats must make the patriotic fight to restore the American Dream the beating heart of our party.

November 10, 2025 at 6:32 PM
NEW from @deluzio.house.gov:
It’s not just the rent that’s too damn high — it’s everything.
The American Dream isn’t real for a lot of hardworking people; it’s been ripped away.
Democrats must make the patriotic fight to restore the American Dream the beating heart of our party.
It’s not just the rent that’s too damn high — it’s everything.
The American Dream isn’t real for a lot of hardworking people; it’s been ripped away.
Democrats must make the patriotic fight to restore the American Dream the beating heart of our party.
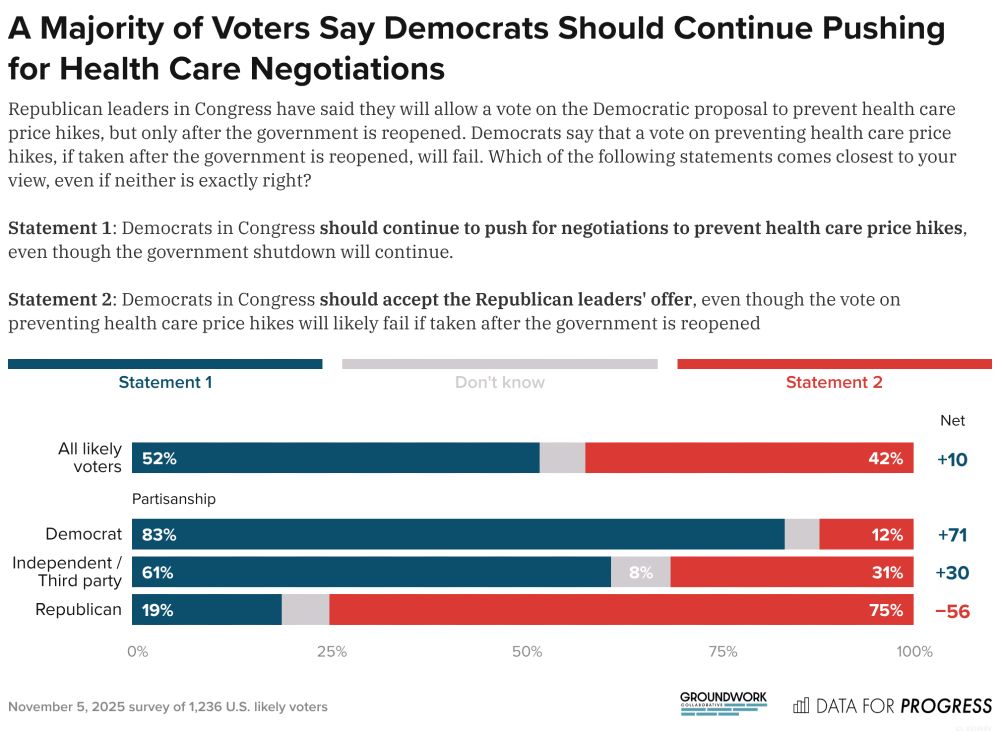
NEW: After being provided with information on the government shutdown dynamic in Congress, a majority of voters (52%), including 61% of Independents, think Democrats should continue to push for negotiations to prevent health care price hikes.
November 7, 2025 at 7:39 PM
NEW: After being provided with information on the government shutdown dynamic in Congress, a majority of voters (52%), including 61% of Independents, think Democrats should continue to push for negotiations to prevent health care price hikes.
NEW: Voters have a highly favorable view of SNAP, including 71% of Independents and 69% of Republicans.
Voters trust the Democratic Party (51%) more than the Republican Party (43%) to handle SNAP.
www.dataforprogress.org/blog/2025/11...
Voters trust the Democratic Party (51%) more than the Republican Party (43%) to handle SNAP.
www.dataforprogress.org/blog/2025/11...

November 6, 2025 at 7:06 PM
NEW: Voters have a highly favorable view of SNAP, including 71% of Independents and 69% of Republicans.
Voters trust the Democratic Party (51%) more than the Republican Party (43%) to handle SNAP.
www.dataforprogress.org/blog/2025/11...
Voters trust the Democratic Party (51%) more than the Republican Party (43%) to handle SNAP.
www.dataforprogress.org/blog/2025/11...
Reposted by Data for Progress

zohran's election wasn't just a quirk of NYC — his policies are popular nationwide. voters want to see moral conviction and concrete plans to lower costs
NEW DFP Insight:
Voters everywhere respond when a candidate connects economic populism to clear, actionable goals.
Zohran Mamdani's policies are key examples — and they have popular appeal nationwide.
www.dataforprogress.org/insights/202...
Voters everywhere respond when a candidate connects economic populism to clear, actionable goals.
Zohran Mamdani's policies are key examples — and they have popular appeal nationwide.
www.dataforprogress.org/insights/202...

November 5, 2025 at 8:45 PM
zohran's election wasn't just a quirk of NYC — his policies are popular nationwide. voters want to see moral conviction and concrete plans to lower costs
NEW DFP Insight:
Voters everywhere respond when a candidate connects economic populism to clear, actionable goals.
Zohran Mamdani's policies are key examples — and they have popular appeal nationwide.
www.dataforprogress.org/insights/202...
Voters everywhere respond when a candidate connects economic populism to clear, actionable goals.
Zohran Mamdani's policies are key examples — and they have popular appeal nationwide.
www.dataforprogress.org/insights/202...
November 5, 2025 at 8:16 PM
NEW DFP Insight:
Voters everywhere respond when a candidate connects economic populism to clear, actionable goals.
Zohran Mamdani's policies are key examples — and they have popular appeal nationwide.
www.dataforprogress.org/insights/202...
Voters everywhere respond when a candidate connects economic populism to clear, actionable goals.
Zohran Mamdani's policies are key examples — and they have popular appeal nationwide.
www.dataforprogress.org/insights/202...
NEW AK POLL:
We find that Mary Peltola leads Sen. Sullivan by one point in a hypothetical Senate race.
If she were to run for governor, we find Peltola in a commanding lead, leading the next Republican candidate by 31 points in the first round of ranked choice voting.
We find that Mary Peltola leads Sen. Sullivan by one point in a hypothetical Senate race.
If she were to run for governor, we find Peltola in a commanding lead, leading the next Republican candidate by 31 points in the first round of ranked choice voting.

November 3, 2025 at 6:16 PM
NEW AK POLL:
We find that Mary Peltola leads Sen. Sullivan by one point in a hypothetical Senate race.
If she were to run for governor, we find Peltola in a commanding lead, leading the next Republican candidate by 31 points in the first round of ranked choice voting.
We find that Mary Peltola leads Sen. Sullivan by one point in a hypothetical Senate race.
If she were to run for governor, we find Peltola in a commanding lead, leading the next Republican candidate by 31 points in the first round of ranked choice voting.
NEW: Energy prices are straining Americans.
But voters like renewable energy, view wind and solar as the cheapest forms of energy, and don't blame renewables for high prices.
That gives Democrats the high ground to go on offense on energy prices.
Read our new DFP Insight: ⤵️
But voters like renewable energy, view wind and solar as the cheapest forms of energy, and don't blame renewables for high prices.
That gives Democrats the high ground to go on offense on energy prices.
Read our new DFP Insight: ⤵️
![Bar chart of polling data from Data For Progress.
Title: Voters Most Blame Utility Companies for Higher Electric Utility Bills.
Description: Who or what do you think is most responsible for higher electric utility bills?
Utility companies increasing profits — 38%
Increased energy demand from new industries (like AI) — 14%
Extreme weather events causing higher energy demand — 11%
Aging or inadequate energy infrastructure — 10%
Foreign conflicts limiting energy supply — 9%
Increased reliance on fossil fuels — 8%
Increased reliance on wind and solar energy — 5%
Something else [please specify] — 5%
September 19–22, 2025 survey of 1,361 U.S. likely voters.](https://cdn.bsky.app/img/feed_thumbnail/plain/did:plc:ltzetlayeqsp4qu7pb4irz24/bafkreicouunabznliggsr54sfsz7tvrxmqpbjtbej3fh6ro7qdezs76jlm@jpeg)
October 31, 2025 at 2:06 PM
NEW: Energy prices are straining Americans.
But voters like renewable energy, view wind and solar as the cheapest forms of energy, and don't blame renewables for high prices.
That gives Democrats the high ground to go on offense on energy prices.
Read our new DFP Insight: ⤵️
But voters like renewable energy, view wind and solar as the cheapest forms of energy, and don't blame renewables for high prices.
That gives Democrats the high ground to go on offense on energy prices.
Read our new DFP Insight: ⤵️
Reposted by Data for Progress
I’m deeply honored to lead Data for Progress into our next chapter.
The point of our research is not to determine what our values should be, but how to fight for our values most effectively.
Excited to keep working with our amazing, dedicated team to sharpen our strategy.
The point of our research is not to determine what our values should be, but how to fight for our values most effectively.
Excited to keep working with our amazing, dedicated team to sharpen our strategy.
We are thrilled to announce that @rodonnell.bsky.social has been named the next executive director of Data for Progress!
Ryan is an expert in survey methodology with a long history in progressive and union politics — he has worked with DFP since 2019 to shape our electoral polling.
Ryan is an expert in survey methodology with a long history in progressive and union politics — he has worked with DFP since 2019 to shape our electoral polling.
October 30, 2025 at 3:15 PM
I’m deeply honored to lead Data for Progress into our next chapter.
The point of our research is not to determine what our values should be, but how to fight for our values most effectively.
Excited to keep working with our amazing, dedicated team to sharpen our strategy.
The point of our research is not to determine what our values should be, but how to fight for our values most effectively.
Excited to keep working with our amazing, dedicated team to sharpen our strategy.