


Andreas Åkre Solberg
@datastories.bsky.social
Passionate about all things data — APIs, data science, visualization, and storytelling.
Hvordan stemmer redaktøren, journalisten og befolkningen ulikt?
#politikk #media
@arbeiderpartiet.bsky.social @hoyre.bsky.social @venstre.no @sv.no @mdg.no @roedt.no @fremskrittspartiet.bsky.social
Kilde: medieundersøkelsen 2024
#politikk #media
@arbeiderpartiet.bsky.social @hoyre.bsky.social @venstre.no @sv.no @mdg.no @roedt.no @fremskrittspartiet.bsky.social
Kilde: medieundersøkelsen 2024

April 14, 2025 at 9:44 AM
Hvordan stemmer redaktøren, journalisten og befolkningen ulikt?
#politikk #media
@arbeiderpartiet.bsky.social @hoyre.bsky.social @venstre.no @sv.no @mdg.no @roedt.no @fremskrittspartiet.bsky.social
Kilde: medieundersøkelsen 2024
#politikk #media
@arbeiderpartiet.bsky.social @hoyre.bsky.social @venstre.no @sv.no @mdg.no @roedt.no @fremskrittspartiet.bsky.social
Kilde: medieundersøkelsen 2024
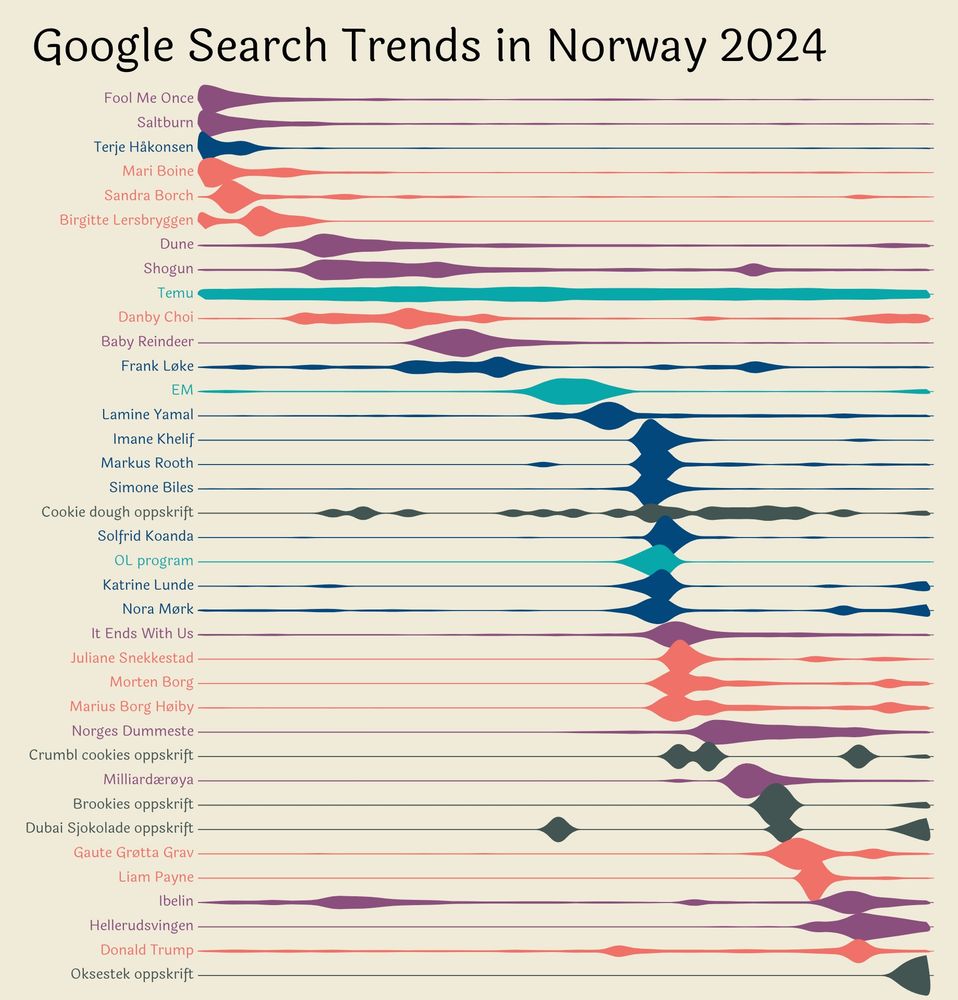
#Google search trends in #Norway 2024 - the top search trends throughout 2024.
Inspired by the great work of @ansgarw.bsky.social
I used coolors.co to create the palette, and the font is Laila from Google Fonts. As always I use @observablehq.com notebooks. #d3js #dataviz
Inspired by the great work of @ansgarw.bsky.social
I used coolors.co to create the palette, and the font is Laila from Google Fonts. As always I use @observablehq.com notebooks. #d3js #dataviz
December 13, 2024 at 9:34 PM
#Google search trends in #Norway 2024 - the top search trends throughout 2024.
Inspired by the great work of @ansgarw.bsky.social
I used coolors.co to create the palette, and the font is Laila from Google Fonts. As always I use @observablehq.com notebooks. #d3js #dataviz
Inspired by the great work of @ansgarw.bsky.social
I used coolors.co to create the palette, and the font is Laila from Google Fonts. As always I use @observablehq.com notebooks. #d3js #dataviz
#30DayMapChallenge - Day 30 - the final map
Last Christmas I swapped Sudoku for creating metro #maps with algorithms from bus routes in #Trondheim. Schematic maps—45°/90° angles, minimal overlap, perfect labels—are full of fascinating algorithmic challenges. 🚍🗺️
#dataviz #norway #bus #metro
Last Christmas I swapped Sudoku for creating metro #maps with algorithms from bus routes in #Trondheim. Schematic maps—45°/90° angles, minimal overlap, perfect labels—are full of fascinating algorithmic challenges. 🚍🗺️
#dataviz #norway #bus #metro

November 30, 2024 at 6:08 PM
#30DayMapChallenge - Day 30 - the final map
Last Christmas I swapped Sudoku for creating metro #maps with algorithms from bus routes in #Trondheim. Schematic maps—45°/90° angles, minimal overlap, perfect labels—are full of fascinating algorithmic challenges. 🚍🗺️
#dataviz #norway #bus #metro
Last Christmas I swapped Sudoku for creating metro #maps with algorithms from bus routes in #Trondheim. Schematic maps—45°/90° angles, minimal overlap, perfect labels—are full of fascinating algorithmic challenges. 🚍🗺️
#dataviz #norway #bus #metro

This is our future!
3085 primary schools spread across Norway.
The visualization shows the number of pupils per location.
#30DayMapChallenge day 18 - 3D
#dataviz #norway #education #deckgl
3085 primary schools spread across Norway.
The visualization shows the number of pupils per location.
#30DayMapChallenge day 18 - 3D
#dataviz #norway #education #deckgl

November 20, 2024 at 8:23 PM
This is our future!
3085 primary schools spread across Norway.
The visualization shows the number of pupils per location.
#30DayMapChallenge day 18 - 3D
#dataviz #norway #education #deckgl
3085 primary schools spread across Norway.
The visualization shows the number of pupils per location.
#30DayMapChallenge day 18 - 3D
#dataviz #norway #education #deckgl
#30DayMapChallenge Day 15 - My data
Beautiful Herøy in Nordland municipality with 1700 islands and 1800 inhabitants. My wife grew up here.
Beautiful Herøy in Nordland municipality with 1700 islands and 1800 inhabitants. My wife grew up here.

November 15, 2024 at 5:39 PM
#30DayMapChallenge Day 15 - My data
Beautiful Herøy in Nordland municipality with 1700 islands and 1800 inhabitants. My wife grew up here.
Beautiful Herøy in Nordland municipality with 1700 islands and 1800 inhabitants. My wife grew up here.
Every day Feide brings together 3.359 schools in Norway with 958 edTech services, empowering teachers with the necessary tools to educate the next generation. The #dataviz shows clusters of schools with similar usage patterns.
Made with #d3js @observablehq.com
Note: Distortion applied for privacy.
Made with #d3js @observablehq.com
Note: Distortion applied for privacy.
November 13, 2024 at 7:57 AM
Every day Feide brings together 3.359 schools in Norway with 958 edTech services, empowering teachers with the necessary tools to educate the next generation. The #dataviz shows clusters of schools with similar usage patterns.
Made with #d3js @observablehq.com
Note: Distortion applied for privacy.
Made with #d3js @observablehq.com
Note: Distortion applied for privacy.
#30DayMapChallenge - Day 12 Time and space
Visualizing our business travels to enhance awareness of our travel habits and promote sustainability.
#dataviz #d3js #map
Visualizing our business travels to enhance awareness of our travel habits and promote sustainability.
#dataviz #d3js #map
November 11, 2024 at 6:58 PM
#30DayMapChallenge - Day 12 Time and space
Visualizing our business travels to enhance awareness of our travel habits and promote sustainability.
#dataviz #d3js #map
Visualizing our business travels to enhance awareness of our travel habits and promote sustainability.
#dataviz #d3js #map
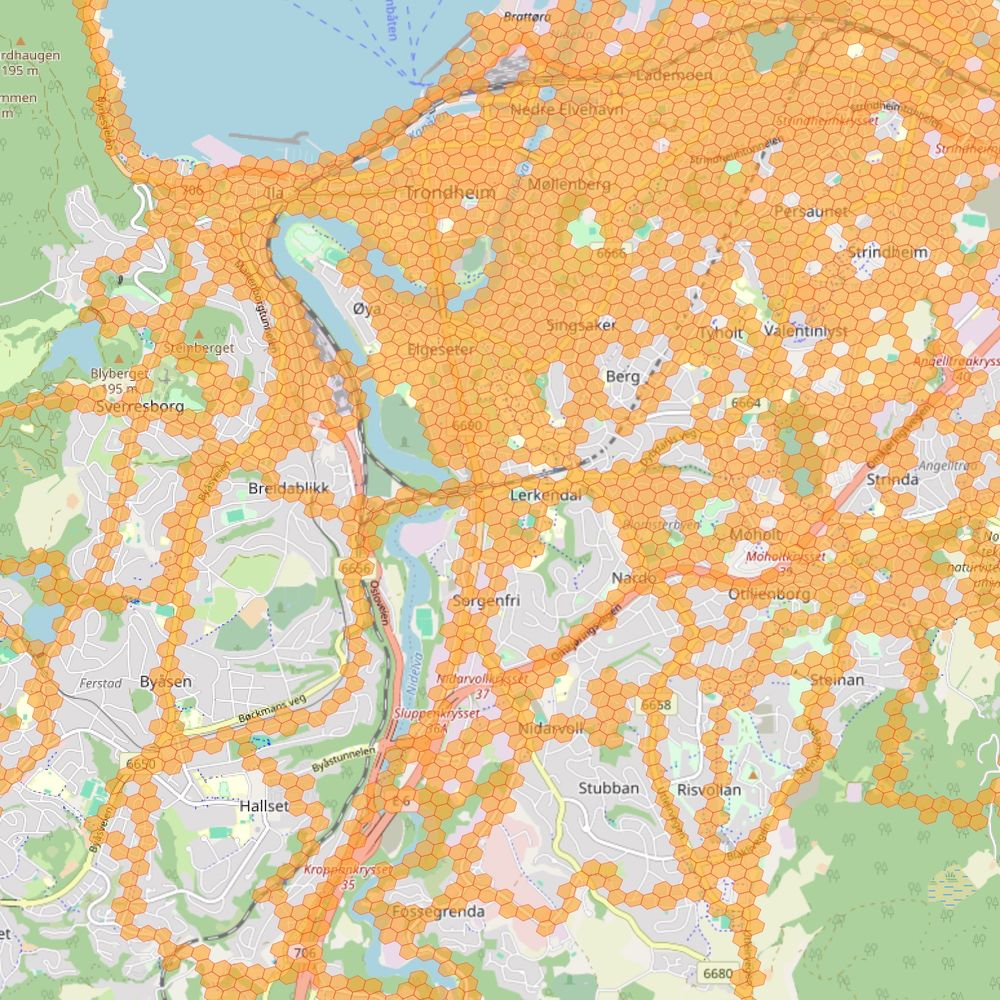
#30DayMapChallenge Day 4 - Hexagons
I collected all track data from my eBike, and filled a hexagon for every area where I have ever been with my bike.
#ebike #dataviz #map
I collected all track data from my eBike, and filled a hexagon for every area where I have ever been with my bike.
#ebike #dataviz #map
November 10, 2024 at 5:06 PM
#30DayMapChallenge Day 4 - Hexagons
I collected all track data from my eBike, and filled a hexagon for every area where I have ever been with my bike.
#ebike #dataviz #map
I collected all track data from my eBike, and filled a hexagon for every area where I have ever been with my bike.
#ebike #dataviz #map
My first #30DayMapChallenge
357 Norwegian municipalities as a non-overlapping hex map. I had to leave some gaps to maintain a recognizable shape of the country.
#dataviz #d3js #30DayChartChallenge #30DaysMapChallenge
357 Norwegian municipalities as a non-overlapping hex map. I had to leave some gaps to maintain a recognizable shape of the country.
#dataviz #d3js #30DayChartChallenge #30DaysMapChallenge

November 5, 2024 at 7:55 PM
My first #30DayMapChallenge
357 Norwegian municipalities as a non-overlapping hex map. I had to leave some gaps to maintain a recognizable shape of the country.
#dataviz #d3js #30DayChartChallenge #30DaysMapChallenge
357 Norwegian municipalities as a non-overlapping hex map. I had to leave some gaps to maintain a recognizable shape of the country.
#dataviz #d3js #30DayChartChallenge #30DaysMapChallenge
