


Fathom Information Design
@fathom.info
We build platforms and products for understanding data. https://fathom.info/
We are beyond excited that our collaboration with the Sabeti Lab and IGH to develop an outbreak detection and response framework has been awarded the MacArthur Foundation 100&Change grant!
You can check out the announcement here: www.macfound.org/press/press-...
You can check out the announcement here: www.macfound.org/press/press-...


November 20, 2025 at 8:59 PM
We are beyond excited that our collaboration with the Sabeti Lab and IGH to develop an outbreak detection and response framework has been awarded the MacArthur Foundation 100&Change grant!
You can check out the announcement here: www.macfound.org/press/press-...
You can check out the announcement here: www.macfound.org/press/press-...
We just launched a desktop version of Rowboat!
* Open much larger files (offline!)
* Own Desktop as a one-time purchase.
* Use a double-clickable app that’s even faster than the web version.
Browser or desktop, your data never leaves your machine.
Read more: www.fathom.info/notebook/251...
* Open much larger files (offline!)
* Own Desktop as a one-time purchase.
* Use a double-clickable app that’s even faster than the web version.
Browser or desktop, your data never leaves your machine.
Read more: www.fathom.info/notebook/251...

November 10, 2025 at 4:50 PM
We just launched a desktop version of Rowboat!
* Open much larger files (offline!)
* Own Desktop as a one-time purchase.
* Use a double-clickable app that’s even faster than the web version.
Browser or desktop, your data never leaves your machine.
Read more: www.fathom.info/notebook/251...
* Open much larger files (offline!)
* Own Desktop as a one-time purchase.
* Use a double-clickable app that’s even faster than the web version.
Browser or desktop, your data never leaves your machine.
Read more: www.fathom.info/notebook/251...
Following the completion of his summer 2024 internship, we now welcome Andy back as a full time member of the team.
October 20, 2025 at 5:57 PM
Following the completion of his summer 2024 internship, we now welcome Andy back as a full time member of the team.
Voitko sanoa uudelleen? Outside of the studio, Mark’s been studying Finnish and Paul’s learning type design. We’re delighted by these unique Finnish cheatsheets they designed using Paul’s work-in-progress font Lilliput.
#typedesign #finnish #typography #languagelearning #liliput
#typedesign #finnish #typography #languagelearning #liliput


October 17, 2025 at 1:31 PM
Voitko sanoa uudelleen? Outside of the studio, Mark’s been studying Finnish and Paul’s learning type design. We’re delighted by these unique Finnish cheatsheets they designed using Paul’s work-in-progress font Lilliput.
#typedesign #finnish #typography #languagelearning #liliput
#typedesign #finnish #typography #languagelearning #liliput
Rowboat makes it easy to explore data by filtering down to different subsets.
In this UFO sightings dataset (rowboat.net/f/uzu782mq), ppen the Find tool and filter the “datetime_time” column with “7/4” to see how many sightings happened on July 4th.
In this UFO sightings dataset (rowboat.net/f/uzu782mq), ppen the Find tool and filter the “datetime_time” column with “7/4” to see how many sightings happened on July 4th.


October 2, 2025 at 1:48 PM
Rowboat makes it easy to explore data by filtering down to different subsets.
In this UFO sightings dataset (rowboat.net/f/uzu782mq), ppen the Find tool and filter the “datetime_time” column with “7/4” to see how many sightings happened on July 4th.
In this UFO sightings dataset (rowboat.net/f/uzu782mq), ppen the Find tool and filter the “datetime_time” column with “7/4” to see how many sightings happened on July 4th.
We recently made a round of visual updates to Rowboat to make it even easier to spot geographic regions where data is more highly concentrated.
To get more out of your own geographic data, head to www.rowboat.net
To get more out of your own geographic data, head to www.rowboat.net


September 23, 2025 at 6:16 PM
We recently made a round of visual updates to Rowboat to make it even easier to spot geographic regions where data is more highly concentrated.
To get more out of your own geographic data, head to www.rowboat.net
To get more out of your own geographic data, head to www.rowboat.net
We updated Rowboat’s Chrome extension to open HTML tables and links to .csv, .tsv, and .xls spreadsheets in your browser with a simple right click.
Just locate the dataset you want to examine, right click, and select “Open Table in Rowboat” to start exploring.
Just locate the dataset you want to examine, right click, and select “Open Table in Rowboat” to start exploring.
September 17, 2025 at 8:00 PM
We updated Rowboat’s Chrome extension to open HTML tables and links to .csv, .tsv, and .xls spreadsheets in your browser with a simple right click.
Just locate the dataset you want to examine, right click, and select “Open Table in Rowboat” to start exploring.
Just locate the dataset you want to examine, right click, and select “Open Table in Rowboat” to start exploring.
In our latest blog post, Chase gives us a lesson in wet-bulb temperature calculations, conversing with coworkers while running, and the perks of opting out of the MBTA for your morning commute.
You can read more here: www.fathom.info/notebook/250...
You can read more here: www.fathom.info/notebook/250...

August 22, 2025 at 5:37 PM
In our latest blog post, Chase gives us a lesson in wet-bulb temperature calculations, conversing with coworkers while running, and the perks of opting out of the MBTA for your morning commute.
You can read more here: www.fathom.info/notebook/250...
You can read more here: www.fathom.info/notebook/250...
A few weeks ago, we survived another "Fathom Song Guessing Game" — my favorite day of the year when we all get to know each other a bit better via our musical selections.
This year's theme was UNLEASH THE BEAST.
We have since managed to re-leash our beasts, and the office is back in order.
This year's theme was UNLEASH THE BEAST.
We have since managed to re-leash our beasts, and the office is back in order.

August 12, 2025 at 3:34 PM
A few weeks ago, we survived another "Fathom Song Guessing Game" — my favorite day of the year when we all get to know each other a bit better via our musical selections.
This year's theme was UNLEASH THE BEAST.
We have since managed to re-leash our beasts, and the office is back in order.
This year's theme was UNLEASH THE BEAST.
We have since managed to re-leash our beasts, and the office is back in order.
📸 Rowboat's header snapshot feature makes it easy to discover insights and instantly share your findings. When you spot something interesting, you’re just a click away from getting it in front of your team or shared online!
Check out the datasets on rowboat.xyz/!
Check out the datasets on rowboat.xyz/!
July 25, 2025 at 2:13 PM
📸 Rowboat's header snapshot feature makes it easy to discover insights and instantly share your findings. When you spot something interesting, you’re just a click away from getting it in front of your team or shared online!
Check out the datasets on rowboat.xyz/!
Check out the datasets on rowboat.xyz/!
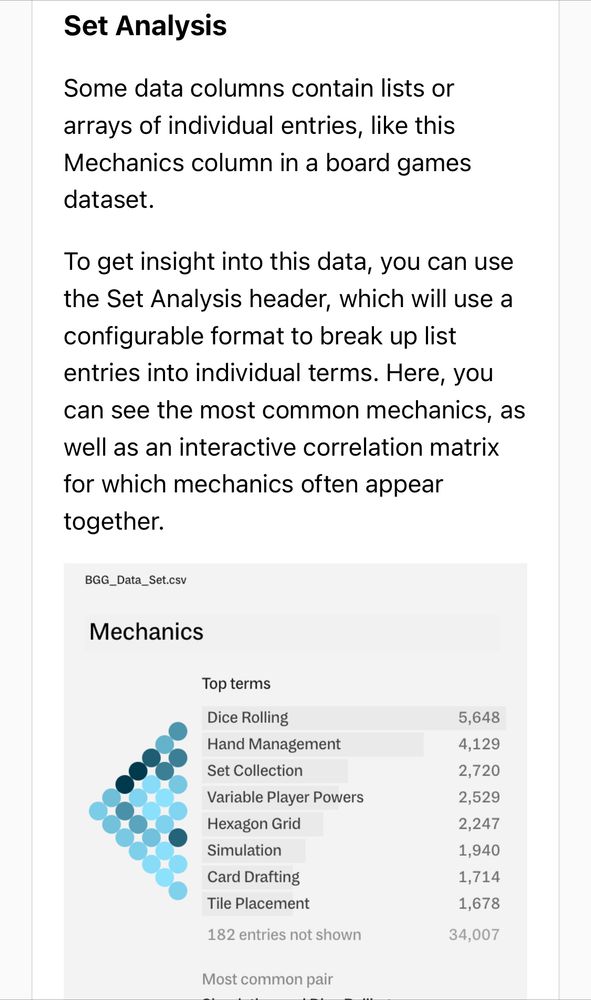
When your dataset contains columns with lists or arrays instead of single values, the Set Analysis header in Rowboat breaks these entries apart so you can analyze each term individually.
Explore this BoardGameGeek dataset: rowboat.xyz/f/mczim00b
Explore this BoardGameGeek dataset: rowboat.xyz/f/mczim00b
July 8, 2025 at 9:23 PM
When your dataset contains columns with lists or arrays instead of single values, the Set Analysis header in Rowboat breaks these entries apart so you can analyze each term individually.
Explore this BoardGameGeek dataset: rowboat.xyz/f/mczim00b
Explore this BoardGameGeek dataset: rowboat.xyz/f/mczim00b
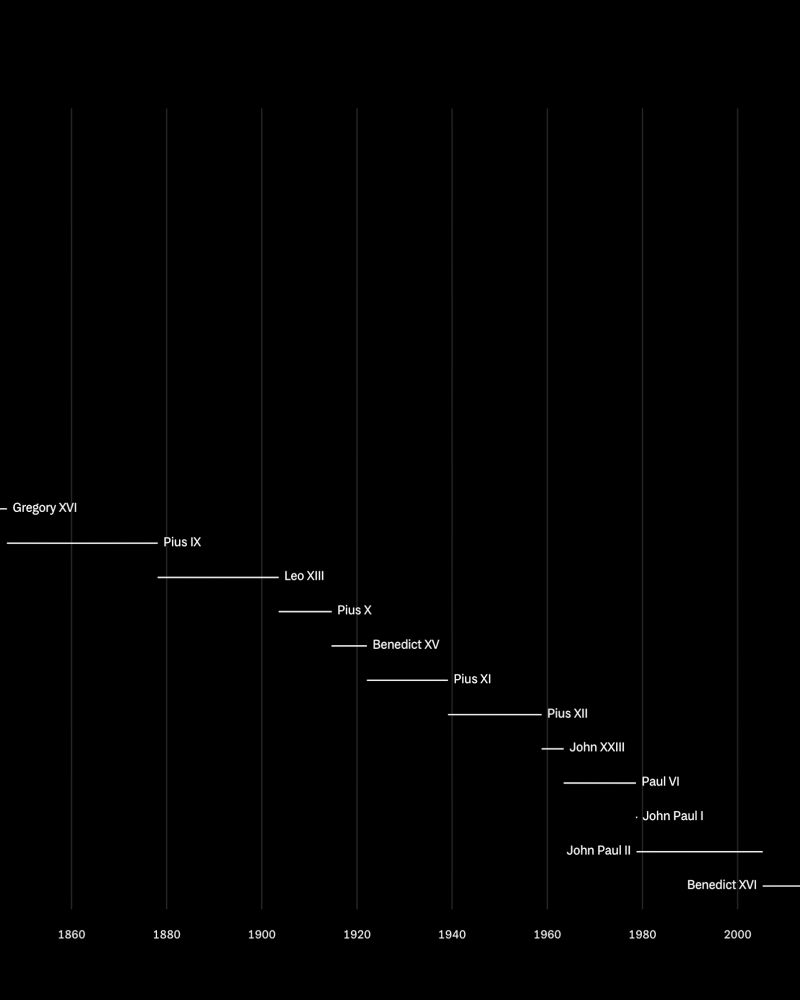
We recently dove into papal history, tracking the length of every papacy from 30 AD to 2013.
If your data contains paired values — start and end, or minimum and maximum, just link them and explore the ranges!
Explore the pope dataset with Rowboat 🚣 : rowboat.xyz/f/wvjko69a
If your data contains paired values — start and end, or minimum and maximum, just link them and explore the ranges!
Explore the pope dataset with Rowboat 🚣 : rowboat.xyz/f/wvjko69a


June 27, 2025 at 9:06 PM
We recently dove into papal history, tracking the length of every papacy from 30 AD to 2013.
If your data contains paired values — start and end, or minimum and maximum, just link them and explore the ranges!
Explore the pope dataset with Rowboat 🚣 : rowboat.xyz/f/wvjko69a
If your data contains paired values — start and end, or minimum and maximum, just link them and explore the ranges!
Explore the pope dataset with Rowboat 🚣 : rowboat.xyz/f/wvjko69a
We are so excited to welcome Karlie as the latest addition to our team!
Karlie is an interdisciplinary designer and developer with an affinity for textile-oriented projects. Check out some of Karlie's incredible work here!
Karlie is an interdisciplinary designer and developer with an affinity for textile-oriented projects. Check out some of Karlie's incredible work here!
June 26, 2025 at 5:37 PM
We are so excited to welcome Karlie as the latest addition to our team!
Karlie is an interdisciplinary designer and developer with an affinity for textile-oriented projects. Check out some of Karlie's incredible work here!
Karlie is an interdisciplinary designer and developer with an affinity for textile-oriented projects. Check out some of Karlie's incredible work here!
Reposted by Fathom Information Design
I really like Rowboat for introducing students to CSVs, and I’m excited about this new set analysis feature. Lists of items in one column is a really common problem for students to deal with.
June 25, 2025 at 3:13 PM
I really like Rowboat for introducing students to CSVs, and I’m excited about this new set analysis feature. Lists of items in one column is a really common problem for students to deal with.
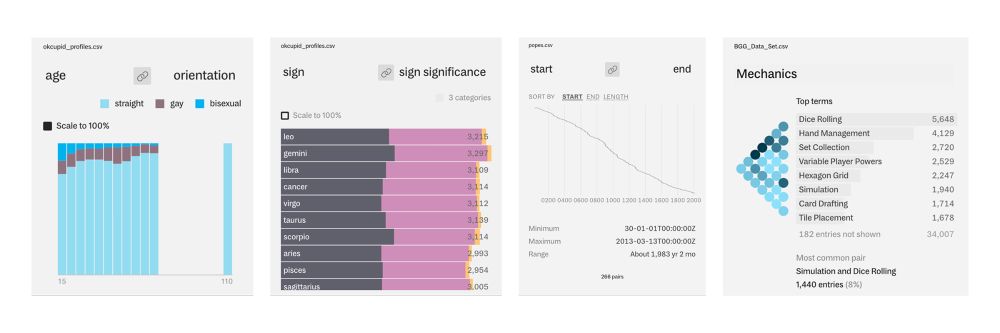
Last September, we launched Rowboat — a tool for getting a quick, meaningful first look at your data. Today, we’re excited to share some new features to help you explore your data visually and answer even more questions. Dive in! 🌊
Explore the OKCupid dataset: rowboat.xyz/f/oxr6zumn
Explore the OKCupid dataset: rowboat.xyz/f/oxr6zumn


June 24, 2025 at 7:52 PM
Last September, we launched Rowboat — a tool for getting a quick, meaningful first look at your data. Today, we’re excited to share some new features to help you explore your data visually and answer even more questions. Dive in! 🌊
Explore the OKCupid dataset: rowboat.xyz/f/oxr6zumn
Explore the OKCupid dataset: rowboat.xyz/f/oxr6zumn
We have a ton of updates we're excited to share about Rowboat, our tool for making sense of large datasets. Read about it on our blog: fathom.info/notebook/250...
We'll also be continuing to share some of these features in more detail here, so keep an eye out for those!
We'll also be continuing to share some of these features in more detail here, so keep an eye out for those!
Rowboat: Nine Months Down the River | Fathom Information Design
Lots to share since launching Rowboat: stacks, ranges, bars, and more to come!
fathom.info
June 18, 2025 at 8:08 PM
We have a ton of updates we're excited to share about Rowboat, our tool for making sense of large datasets. Read about it on our blog: fathom.info/notebook/250...
We'll also be continuing to share some of these features in more detail here, so keep an eye out for those!
We'll also be continuing to share some of these features in more detail here, so keep an eye out for those!
Reposted by Fathom Information Design

Issued in Japan in the early 1950s, two books of Tokyo Post Office infographics. Featuring lots of cute illustrations!
dl.ndl.go.jp/pid/2473430/...
dl.ndl.go.jp/pid/2473426/...
dl.ndl.go.jp/pid/2473430/...
dl.ndl.go.jp/pid/2473426/...


June 11, 2025 at 5:10 PM
Issued in Japan in the early 1950s, two books of Tokyo Post Office infographics. Featuring lots of cute illustrations!
dl.ndl.go.jp/pid/2473430/...
dl.ndl.go.jp/pid/2473426/...
dl.ndl.go.jp/pid/2473430/...
dl.ndl.go.jp/pid/2473426/...
Reposted by Fathom Information Design

Sierra Leone is battling an mpox variant, G.1, that is rapidly spreading—25% hospitalized, thousands likely infected, cases doubling every two weeks, and now detected in the US & Europe. The country is responding. The world must join them. time.com/7291478/sier...

What Happens in Sierra Leone's Mpox Outbreak Affects Us All
"Mpox, as a pandemic, could be brutal," write Pardis Sabeti and Christian Happi.
time.com
June 11, 2025 at 5:57 PM
Sierra Leone is battling an mpox variant, G.1, that is rapidly spreading—25% hospitalized, thousands likely infected, cases doubling every two weeks, and now detected in the US & Europe. The country is responding. The world must join them. time.com/7291478/sier...
We're immensely proud of the work we're able to do with @pardissabeti.bsky.social and the Sentinel team at @sabetilab.bsky.social in building systems to get ahead of viral outbreaks, like the mpox outbreak unfolding in Sierra Leone now.
Read more in this latest article:
time.com/7291478/sier...
Read more in this latest article:
time.com/7291478/sier...

What Happens in Sierra Leone's Mpox Outbreak Affects Us All
"Mpox, as a pandemic, could be brutal," write Pardis Sabeti and Christian Happi.
time.com
June 11, 2025 at 8:53 PM
We're immensely proud of the work we're able to do with @pardissabeti.bsky.social and the Sentinel team at @sabetilab.bsky.social in building systems to get ahead of viral outbreaks, like the mpox outbreak unfolding in Sierra Leone now.
Read more in this latest article:
time.com/7291478/sier...
Read more in this latest article:
time.com/7291478/sier...
Thanks for checking it out, Marius!

The Rowboat CSV explorer by @fathom.info is a wonder. No need to open Excel, fix formatting and create the same old formulas to find min/max/median. Skip setting up a test app to see basic graphs. Just drop it in Rowboat.
rowboat.xyz
rowboat.xyz
May 28, 2025 at 6:54 PM
Thanks for checking it out, Marius!
All three top runners in the women's division of the Boston Marathon crushed the previous time record this year!
We took a look at the trends in finish times over the race's history, and were struck by the rapid leaps in record breaking over the first two decades women were allowed to compete.
We took a look at the trends in finish times over the race's history, and were struck by the rapid leaps in record breaking over the first two decades women were allowed to compete.
April 25, 2025 at 7:46 PM
All three top runners in the women's division of the Boston Marathon crushed the previous time record this year!
We took a look at the trends in finish times over the race's history, and were struck by the rapid leaps in record breaking over the first two decades women were allowed to compete.
We took a look at the trends in finish times over the race's history, and were struck by the rapid leaps in record breaking over the first two decades women were allowed to compete.
Mark and Paul recently spent some time tinkering with new ways to show an outbreak moving over space, time, and population.
April 16, 2025 at 3:56 PM
Mark and Paul recently spent some time tinkering with new ways to show an outbreak moving over space, time, and population.
Reposted by Fathom Information Design
We’re excited to share the completed preprint of Delphy — our new tool for scalable, near-real-time #Bayesianphylogenetics for outbreaks! 🚀
Check it out here: www.biorxiv.org/content/10.1...
Explore Delphy: delphy.fathom.info
Led by #PatrickVarilly @sabetilab.bsky.social @fathom.info 🧵1/17
Check it out here: www.biorxiv.org/content/10.1...
Explore Delphy: delphy.fathom.info
Led by #PatrickVarilly @sabetilab.bsky.social @fathom.info 🧵1/17

Delphy: scalable, near-real-time Bayesian phylogenetics for outbreaks
Pathogen genomic analysis is central to tracking, understanding, and containing outbreaks, but complexity and high costs of state-of-the-art (SOTA) phylogenetic tools limit global access and impact. W...
www.biorxiv.org
March 31, 2025 at 3:34 PM
We’re excited to share the completed preprint of Delphy — our new tool for scalable, near-real-time #Bayesianphylogenetics for outbreaks! 🚀
Check it out here: www.biorxiv.org/content/10.1...
Explore Delphy: delphy.fathom.info
Led by #PatrickVarilly @sabetilab.bsky.social @fathom.info 🧵1/17
Check it out here: www.biorxiv.org/content/10.1...
Explore Delphy: delphy.fathom.info
Led by #PatrickVarilly @sabetilab.bsky.social @fathom.info 🧵1/17
Happy Monday! We wanted to share some of the books we've been reading and enjoying lately.

April 14, 2025 at 3:25 PM
Happy Monday! We wanted to share some of the books we've been reading and enjoying lately.
Our recent discovery of a 2018 census of Central Park squirrels inspired Katherine to write up a lovely piece walking through how we can quickly unpack the antics of over 3,000 squirrel with Rowboat — a tool we built for diving into new datasets.
fathom.info/notebook/250...
fathom.info/notebook/250...

Squirreling Around in Rowboat | Fathom Information Design
Playing around with a squirrel census in Rowboat.
fathom.info
March 11, 2025 at 9:46 PM
Our recent discovery of a 2018 census of Central Park squirrels inspired Katherine to write up a lovely piece walking through how we can quickly unpack the antics of over 3,000 squirrel with Rowboat — a tool we built for diving into new datasets.
fathom.info/notebook/250...
fathom.info/notebook/250...