


New England and New York have new ties with Québec coming online over the next 6 months, but is the power there to support them? 🔌💡
Earlier this year we noticed that flows into the US, and particularly New York, had dropped off, years before the threat of tariffs
blog.gridstatus.io/more-hqs-tha...
Earlier this year we noticed that flows into the US, and particularly New York, had dropped off, years before the threat of tariffs
blog.gridstatus.io/more-hqs-tha...

November 21, 2025 at 3:38 PM
New England and New York have new ties with Québec coming online over the next 6 months, but is the power there to support them? 🔌💡
Earlier this year we noticed that flows into the US, and particularly New York, had dropped off, years before the threat of tariffs
blog.gridstatus.io/more-hqs-tha...
Earlier this year we noticed that flows into the US, and particularly New York, had dropped off, years before the threat of tariffs
blog.gridstatus.io/more-hqs-tha...
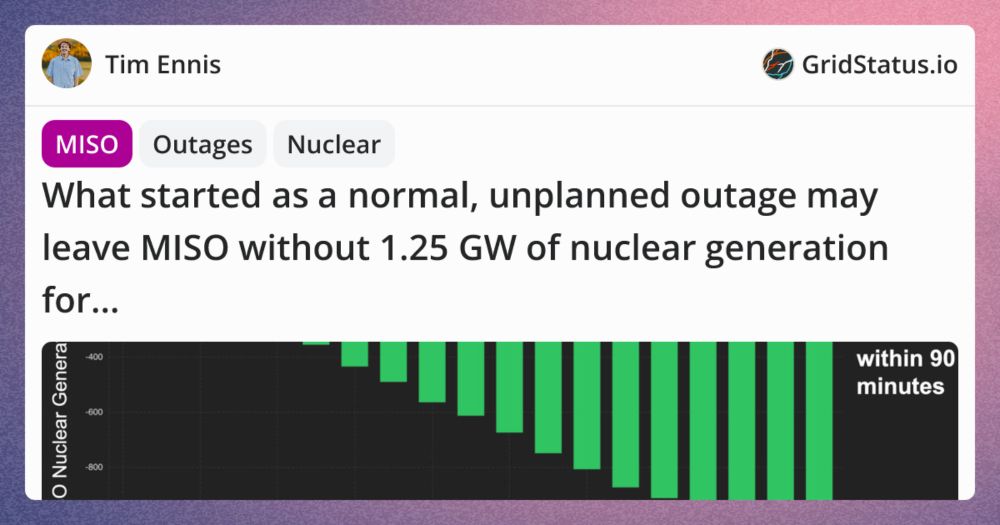
What started as a normal, unplanned outage may leave Midcontinent Independent System Operator (MISO) without 1.25 GW of nuclear generation for an extended period of time 🔌💡
Read more at Grid Status Insights:
www.gridstatus.io/insights/280...
Read more at Grid Status Insights:
www.gridstatus.io/insights/280...
Insights | Grid Status from Tim Ennis
What started as a normal, unplanned outage may leave MISO without 1.25 GW of nuclear generation for an extended period of time.
During the morning of November 12th, 2025, the Callway Nuclear Plant in...
www.gridstatus.io
November 14, 2025 at 2:15 PM
What started as a normal, unplanned outage may leave Midcontinent Independent System Operator (MISO) without 1.25 GW of nuclear generation for an extended period of time 🔌💡
Read more at Grid Status Insights:
www.gridstatus.io/insights/280...
Read more at Grid Status Insights:
www.gridstatus.io/insights/280...
Part two of our Western Markets series went up at the end of last week 🔌💡
this time we focus on SPP West, the undecideds, Canada, and risks in the West
blog.gridstatus.io/western-mark...
this time we focus on SPP West, the undecideds, Canada, and risks in the West
blog.gridstatus.io/western-mark...
November 11, 2025 at 10:11 PM
Part two of our Western Markets series went up at the end of last week 🔌💡
this time we focus on SPP West, the undecideds, Canada, and risks in the West
blog.gridstatus.io/western-mark...
this time we focus on SPP West, the undecideds, Canada, and risks in the West
blog.gridstatus.io/western-mark...
Like any event that changes daily routines, Halloween impacts load curves across the country
Over the past 9 years, real-time load has underperformed almost all of PJM’s forecasts over the evening peak, precisely during prime trick-or-treating hours 🔌💡
Over the past 9 years, real-time load has underperformed almost all of PJM’s forecasts over the evening peak, precisely during prime trick-or-treating hours 🔌💡

October 28, 2025 at 5:23 PM
Like any event that changes daily routines, Halloween impacts load curves across the country
Over the past 9 years, real-time load has underperformed almost all of PJM’s forecasts over the evening peak, precisely during prime trick-or-treating hours 🔌💡
Over the past 9 years, real-time load has underperformed almost all of PJM’s forecasts over the evening peak, precisely during prime trick-or-treating hours 🔌💡
New blog went out yesterday, part one of our look into the overhaul of western markets on the horizon 🔌💡
blog.gridstatus.io/western-mark...
little 🧵
blog.gridstatus.io/western-mark...
little 🧵

CAISO's EDAM and SPP's Markets+ Arrive to Tame the Wild West
With new day-ahead Western markets just over the horizon, it's time to take stock of the field of play. Who's joining what, what do these aggregations look like, and what does it mean for the wider We...
blog.gridstatus.io
October 23, 2025 at 5:43 PM
New blog went out yesterday, part one of our look into the overhaul of western markets on the horizon 🔌💡
blog.gridstatus.io/western-mark...
little 🧵
blog.gridstatus.io/western-mark...
little 🧵
ISO-NE just became the first multi-state ISO to phase out coal, nearly two and a half years ahead of schedule 🔌💡
short 🧵
short 🧵

October 16, 2025 at 1:21 PM
ISO-NE just became the first multi-state ISO to phase out coal, nearly two and a half years ahead of schedule 🔌💡
short 🧵
short 🧵
As PJM prepares its 2026 load outlook utility forecasts show a rapidly shifting landscape, with smaller zones predicting surging demand 🔌💡
A balancing question in play is whether large zones can continue to scale larger, or if small areas have the headroom to steal momentum in the datacenter race
A balancing question in play is whether large zones can continue to scale larger, or if small areas have the headroom to steal momentum in the datacenter race

October 10, 2025 at 1:33 PM
As PJM prepares its 2026 load outlook utility forecasts show a rapidly shifting landscape, with smaller zones predicting surging demand 🔌💡
A balancing question in play is whether large zones can continue to scale larger, or if small areas have the headroom to steal momentum in the datacenter race
A balancing question in play is whether large zones can continue to scale larger, or if small areas have the headroom to steal momentum in the datacenter race
A little teaser of our next product release: Grid Status Insights.
Insights is a real-time feed of expert commentary on energy markets and the electric grid — straight from our team of talented analysts.
If you’ve enjoyed our blogs or social posts, you’re going to love this. Stay tuned 🔌💡
Insights is a real-time feed of expert commentary on energy markets and the electric grid — straight from our team of talented analysts.
If you’ve enjoyed our blogs or social posts, you’re going to love this. Stay tuned 🔌💡

October 9, 2025 at 1:40 PM
A little teaser of our next product release: Grid Status Insights.
Insights is a real-time feed of expert commentary on energy markets and the electric grid — straight from our team of talented analysts.
If you’ve enjoyed our blogs or social posts, you’re going to love this. Stay tuned 🔌💡
Insights is a real-time feed of expert commentary on energy markets and the electric grid — straight from our team of talented analysts.
If you’ve enjoyed our blogs or social posts, you’re going to love this. Stay tuned 🔌💡
We’re early in the process of rolling out a new app— Nodal Analysis. DM if you’d like to test it and share feedback 🔌💡
We built it with two key upgrades:
1. A new database that runs on-demand analysis of years of data in seconds
2. An enhanced process for organizing the metadata for 75k+ locations
We built it with two key upgrades:
1. A new database that runs on-demand analysis of years of data in seconds
2. An enhanced process for organizing the metadata for 75k+ locations
October 6, 2025 at 4:39 PM
We’re early in the process of rolling out a new app— Nodal Analysis. DM if you’d like to test it and share feedback 🔌💡
We built it with two key upgrades:
1. A new database that runs on-demand analysis of years of data in seconds
2. An enhanced process for organizing the metadata for 75k+ locations
We built it with two key upgrades:
1. A new database that runs on-demand analysis of years of data in seconds
2. An enhanced process for organizing the metadata for 75k+ locations
It’s duck hunting season as California’s summer fades away and demand from batteries takes firm grasp of CAISO’s daily demand curves 🔌💡

October 3, 2025 at 2:27 PM
It’s duck hunting season as California’s summer fades away and demand from batteries takes firm grasp of CAISO’s daily demand curves 🔌💡
Net load volatility is on the rise as SPP enters shoulder season 🔌💡
In decades past, the fall shoulder season left time for autumn fun like apple picking and the pumpkin patch. Today, new metrics like net load drive markets, and they can be most volatile when outages rise and weather varies
In decades past, the fall shoulder season left time for autumn fun like apple picking and the pumpkin patch. Today, new metrics like net load drive markets, and they can be most volatile when outages rise and weather varies

September 19, 2025 at 1:08 PM
Net load volatility is on the rise as SPP enters shoulder season 🔌💡
In decades past, the fall shoulder season left time for autumn fun like apple picking and the pumpkin patch. Today, new metrics like net load drive markets, and they can be most volatile when outages rise and weather varies
In decades past, the fall shoulder season left time for autumn fun like apple picking and the pumpkin patch. Today, new metrics like net load drive markets, and they can be most volatile when outages rise and weather varies
ERCOT load-watchers will know that many days this summer have had a strikingly flat peak load curve, driven by curtailment to avoid 4CP intervals. Less clear was just how much of the resulting forecast gap could be driven by extremely flexible crypto demand. It turns out the answer is a lot 🔌💡

September 9, 2025 at 1:19 PM
ERCOT load-watchers will know that many days this summer have had a strikingly flat peak load curve, driven by curtailment to avoid 4CP intervals. Less clear was just how much of the resulting forecast gap could be driven by extremely flexible crypto demand. It turns out the answer is a lot 🔌💡
New blog! This time on Thunderstorm Alerts in NYISO 🔌💡
TSAs are called when enough lightning strikes the Hudson Valley area in a short amount of time. This triggers line limits on the 345kV system flowing into NYC, to avoid conditions 1977 blackout conditions
blog.gridstatus.io/breaking-dow... /1
TSAs are called when enough lightning strikes the Hudson Valley area in a short amount of time. This triggers line limits on the 345kV system flowing into NYC, to avoid conditions 1977 blackout conditions
blog.gridstatus.io/breaking-dow... /1

When Thunder Roars- Breaking Down NYISO’s Thunderstorm Alerts
NYISO's Thunderstorm Alerts have a grim origin, but also represent a unique trading opportunity. We dig into the history, impacts, and changes of this weather-induced market mechanism.
blog.gridstatus.io
September 4, 2025 at 1:34 PM
New blog! This time on Thunderstorm Alerts in NYISO 🔌💡
TSAs are called when enough lightning strikes the Hudson Valley area in a short amount of time. This triggers line limits on the 345kV system flowing into NYC, to avoid conditions 1977 blackout conditions
blog.gridstatus.io/breaking-dow... /1
TSAs are called when enough lightning strikes the Hudson Valley area in a short amount of time. This triggers line limits on the 345kV system flowing into NYC, to avoid conditions 1977 blackout conditions
blog.gridstatus.io/breaking-dow... /1
As Hurricane Erin approached New England last week, a curious thing happened. Wind generation in the ISO plateaued well above forecasts, sitting around the same level through Thursday into Friday
Wind was low onshore, and the MW level approximately matches Vineyard Wind's possible output 🔌💡
Wind was low onshore, and the MW level approximately matches Vineyard Wind's possible output 🔌💡

August 26, 2025 at 1:05 PM
As Hurricane Erin approached New England last week, a curious thing happened. Wind generation in the ISO plateaued well above forecasts, sitting around the same level through Thursday into Friday
Wind was low onshore, and the MW level approximately matches Vineyard Wind's possible output 🔌💡
Wind was low onshore, and the MW level approximately matches Vineyard Wind's possible output 🔌💡
New blog! 🔌💡
Wildfire impacts are now a regular, if unwelcome guest during Northeastern summers, with smoke affecting both solar output and load patterns in New York and New England.
blog.gridstatus.io/canadian-wil...
Wildfire impacts are now a regular, if unwelcome guest during Northeastern summers, with smoke affecting both solar output and load patterns in New York and New England.
blog.gridstatus.io/canadian-wil...
High and Dry: Canadian Wildfire Smoke Complicates Northeastern Grid Operations
Wildfire impacts are now a regular, if unwelcome guest during Northeastern summers, with smoke affecting both solar output and load patterns in New York and New England.
blog.gridstatus.io
August 18, 2025 at 1:08 PM
New blog! 🔌💡
Wildfire impacts are now a regular, if unwelcome guest during Northeastern summers, with smoke affecting both solar output and load patterns in New York and New England.
blog.gridstatus.io/canadian-wil...
Wildfire impacts are now a regular, if unwelcome guest during Northeastern summers, with smoke affecting both solar output and load patterns in New York and New England.
blog.gridstatus.io/canadian-wil...
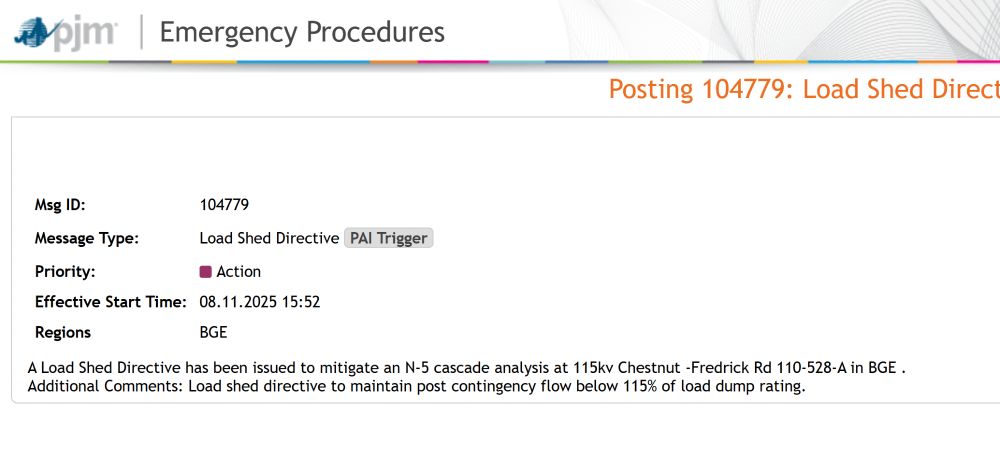
The Baltimore area (BGE) of PJM just entered load shedding 🔌💡
August 11, 2025 at 8:14 PM
The Baltimore area (BGE) of PJM just entered load shedding 🔌💡
Wildfire smoke complicated NYISO’s BTM solar forecast this week, overforecasting by over 500 MW on Monday and underforecasting by 1,000 MW on Tuesday
This miss was not even, downstate zones, home to >50% ofload, hewed more closely to the forecast, while upstate zones saw large swings 🔌💡
This miss was not even, downstate zones, home to >50% ofload, hewed more closely to the forecast, while upstate zones saw large swings 🔌💡

August 8, 2025 at 1:17 PM
Wildfire smoke complicated NYISO’s BTM solar forecast this week, overforecasting by over 500 MW on Monday and underforecasting by 1,000 MW on Tuesday
This miss was not even, downstate zones, home to >50% ofload, hewed more closely to the forecast, while upstate zones saw large swings 🔌💡
This miss was not even, downstate zones, home to >50% ofload, hewed more closely to the forecast, while upstate zones saw large swings 🔌💡
July 29, 2025 at 12:29 AM
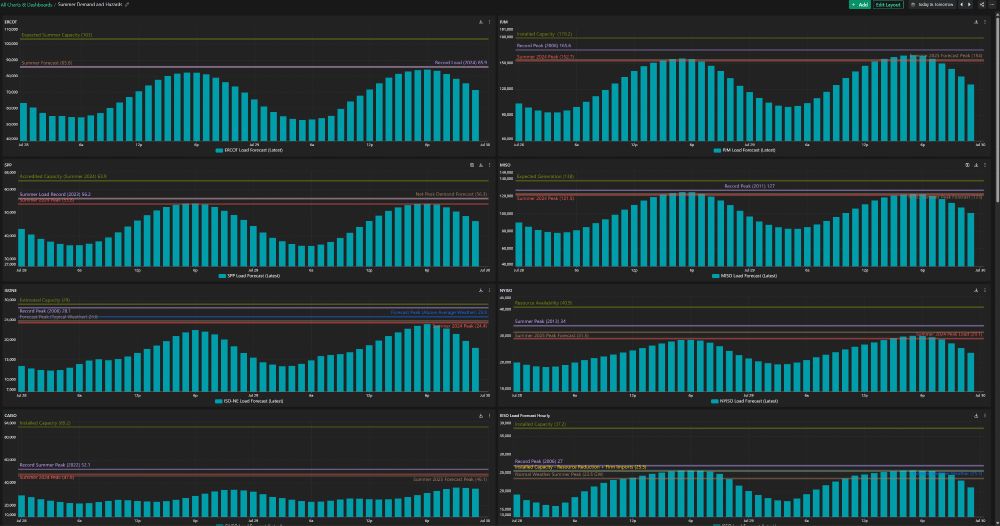
Another hot week across the eastern interconnection 🔌💡
~5 markets look to beat last summer's peak, while 3 seem likely to exceed this summer's forecast peak
You can track the outlook on our summer hazards dashboard: www.gridstatus.io/dashboards/e...
~5 markets look to beat last summer's peak, while 3 seem likely to exceed this summer's forecast peak
You can track the outlook on our summer hazards dashboard: www.gridstatus.io/dashboards/e...
July 28, 2025 at 2:35 PM
Another hot week across the eastern interconnection 🔌💡
~5 markets look to beat last summer's peak, while 3 seem likely to exceed this summer's forecast peak
You can track the outlook on our summer hazards dashboard: www.gridstatus.io/dashboards/e...
~5 markets look to beat last summer's peak, while 3 seem likely to exceed this summer's forecast peak
You can track the outlook on our summer hazards dashboard: www.gridstatus.io/dashboards/e...
new blog! 🔌💡
Digging further into the PPL zone in PJM and capacity constraints in general
blog.gridstatus.io/pjm-ppl-capa...
a few notes: 🧵
Digging further into the PPL zone in PJM and capacity constraints in general
blog.gridstatus.io/pjm-ppl-capa...
a few notes: 🧵
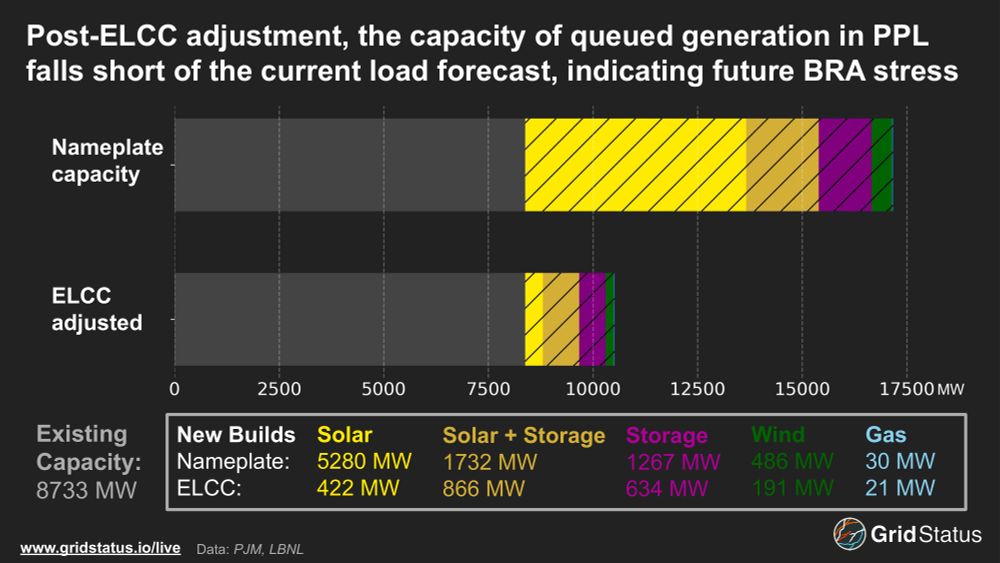
Capacity Constraints in PJM have Grown Beyond Dominion
As tech firms snap up clean firm power with PPAs to power data center load growth, Dominion's demand challenges have spread to PPL. Can PJM as a whole keep up?
blog.gridstatus.io
July 25, 2025 at 1:00 PM
new blog! 🔌💡
Digging further into the PPL zone in PJM and capacity constraints in general
blog.gridstatus.io/pjm-ppl-capa...
a few notes: 🧵
Digging further into the PPL zone in PJM and capacity constraints in general
blog.gridstatus.io/pjm-ppl-capa...
a few notes: 🧵
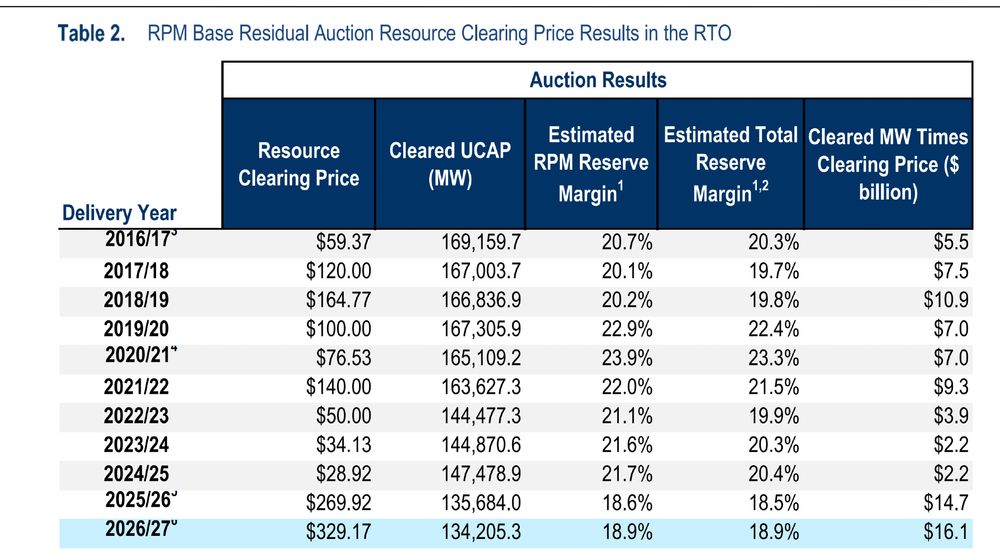
PJM’s 2026/27 BRA cleared at the market cap across the entire RTO,
signaling no end to Big Tech’s insatiable demand for datacenter power
Look for a blog from us later this week on recent PPA action in PPL and PJM's tight capacity conditions. 🔌💡
signaling no end to Big Tech’s insatiable demand for datacenter power
Look for a blog from us later this week on recent PPA action in PPL and PJM's tight capacity conditions. 🔌💡

July 22, 2025 at 9:28 PM
PJM’s 2026/27 BRA cleared at the market cap across the entire RTO,
signaling no end to Big Tech’s insatiable demand for datacenter power
Look for a blog from us later this week on recent PPA action in PPL and PJM's tight capacity conditions. 🔌💡
signaling no end to Big Tech’s insatiable demand for datacenter power
Look for a blog from us later this week on recent PPA action in PPL and PJM's tight capacity conditions. 🔌💡
Reposted by Grid Status

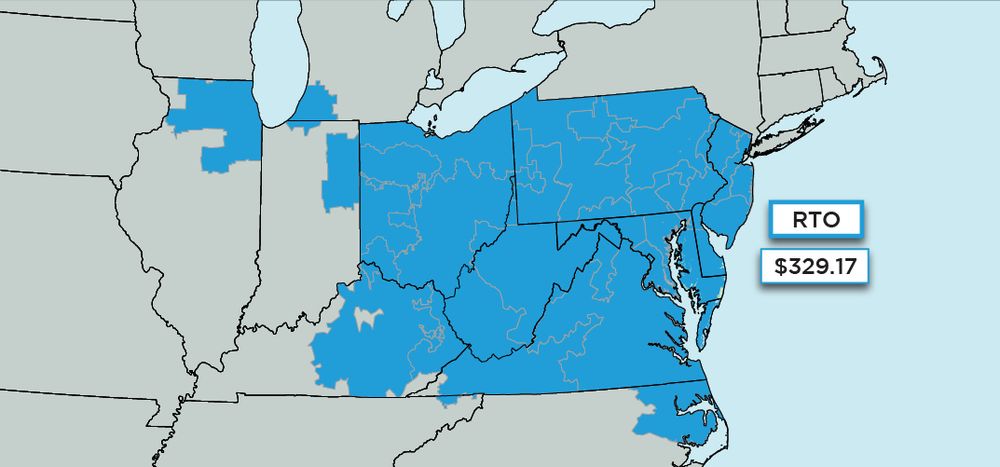
ayyy DOM prices are lower in the 26/27 BRA than last year's auction!
oh, wait, the entire RTO cleared at the cap 🥴
funny map from PJM 🔌💡
oh, wait, the entire RTO cleared at the cap 🥴
funny map from PJM 🔌💡
July 22, 2025 at 8:28 PM
ayyy DOM prices are lower in the 26/27 BRA than last year's auction!
oh, wait, the entire RTO cleared at the cap 🥴
funny map from PJM 🔌💡
oh, wait, the entire RTO cleared at the cap 🥴
funny map from PJM 🔌💡
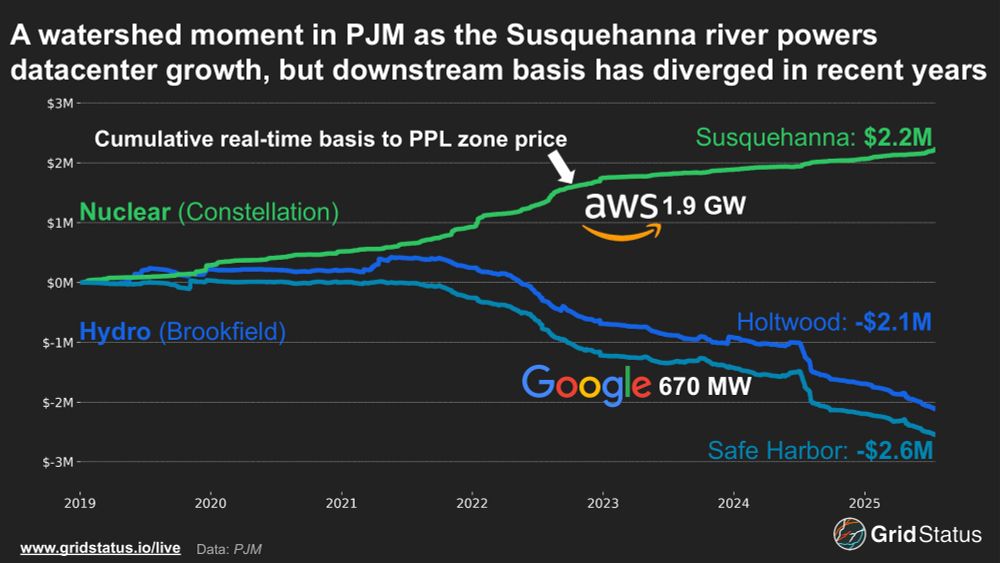
Google’s 670 MW hydroelectric PPA with existing Brookfield hydropower in PJM is a sign of the times.
Also in the PPL zone, Amazon’s attempt to take Talen’s Susquehanna nuclear plant behind-the-meter has been in the news since last year
Over 2.5 GW of data center PPAs signed in a single zone
🔌💡
Also in the PPL zone, Amazon’s attempt to take Talen’s Susquehanna nuclear plant behind-the-meter has been in the news since last year
Over 2.5 GW of data center PPAs signed in a single zone
🔌💡
July 17, 2025 at 2:09 PM
Google’s 670 MW hydroelectric PPA with existing Brookfield hydropower in PJM is a sign of the times.
Also in the PPL zone, Amazon’s attempt to take Talen’s Susquehanna nuclear plant behind-the-meter has been in the news since last year
Over 2.5 GW of data center PPAs signed in a single zone
🔌💡
Also in the PPL zone, Amazon’s attempt to take Talen’s Susquehanna nuclear plant behind-the-meter has been in the news since last year
Over 2.5 GW of data center PPAs signed in a single zone
🔌💡
During the June heatwave, behind-the-meter solar in New England shifted peak demand by 2 hours and nearly 3 GW. Without BTM solar, ISO-NE may have broken its nearly 20 year-old demand record, challenging assumptions about load growth in the region.
🔌💡
🔌💡

July 8, 2025 at 1:10 PM
During the June heatwave, behind-the-meter solar in New England shifted peak demand by 2 hours and nearly 3 GW. Without BTM solar, ISO-NE may have broken its nearly 20 year-old demand record, challenging assumptions about load growth in the region.
🔌💡
🔌💡
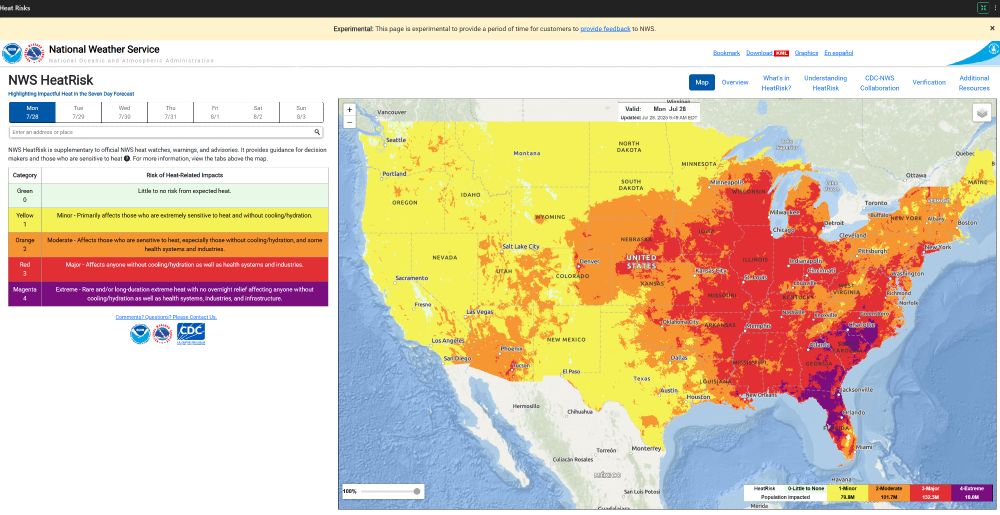
This week, a historic early-season heat wave means grids across the Eastern US and Canada will face record demand 🔌💡
With triple-digit heat indices from the Gulf of Maine to the Gulf of Mexico, here’s what we expect to see across the different grid operators this week:
With triple-digit heat indices from the Gulf of Maine to the Gulf of Mexico, here’s what we expect to see across the different grid operators this week:

June 23, 2025 at 3:22 PM
This week, a historic early-season heat wave means grids across the Eastern US and Canada will face record demand 🔌💡
With triple-digit heat indices from the Gulf of Maine to the Gulf of Mexico, here’s what we expect to see across the different grid operators this week:
With triple-digit heat indices from the Gulf of Maine to the Gulf of Mexico, here’s what we expect to see across the different grid operators this week: