


Meg Forrest 🌳🌲🌳
@meghanforr.bsky.social
Epi research associate + information specialist
Former neuro critical care nurse
Interested in stroke 🧠 epi research (with/&) causal inference methods
she/her
📍 Berlin
#EpiSky #Epidemiology #CausalInference #PublicHealth #AcademicSky
Former neuro critical care nurse
Interested in stroke 🧠 epi research (with/&) causal inference methods
she/her
📍 Berlin
#EpiSky #Epidemiology #CausalInference #PublicHealth #AcademicSky
Pinned
Neurology® Journals
www.neurology.org
📣 New paper!
We investigated the use of stacked proportional bar graphs (aka "Grotta bars") in observational neurology research & made infographics 🎨📊 to guide proper use & interpretation of these figures.
🔓 Read the OA paper: www.neurology.org/doi/10.1212/...
🙈 Spoilers below 👇
We investigated the use of stacked proportional bar graphs (aka "Grotta bars") in observational neurology research & made infographics 🎨📊 to guide proper use & interpretation of these figures.
🔓 Read the OA paper: www.neurology.org/doi/10.1212/...
🙈 Spoilers below 👇
Reposted by Meg Forrest 🌳🌲🌳
Excited to be back in Berlin for the second gathering of the Einstein Circle on Causal Inference from Observational Health Data!
With @jlrohmann.bsky.social, @meghanforr.bsky.social, @chisatoito.bsky.social, @mpiccininni3.bsky.social, Venessa Didilez, Toivo Glatz, Rodrigo Huerta, & others!
#EpiSky
With @jlrohmann.bsky.social, @meghanforr.bsky.social, @chisatoito.bsky.social, @mpiccininni3.bsky.social, Venessa Didilez, Toivo Glatz, Rodrigo Huerta, & others!
#EpiSky

September 18, 2025 at 10:16 AM
Excited to be back in Berlin for the second gathering of the Einstein Circle on Causal Inference from Observational Health Data!
With @jlrohmann.bsky.social, @meghanforr.bsky.social, @chisatoito.bsky.social, @mpiccininni3.bsky.social, Venessa Didilez, Toivo Glatz, Rodrigo Huerta, & others!
#EpiSky
With @jlrohmann.bsky.social, @meghanforr.bsky.social, @chisatoito.bsky.social, @mpiccininni3.bsky.social, Venessa Didilez, Toivo Glatz, Rodrigo Huerta, & others!
#EpiSky
Reposted by Meg Forrest 🌳🌲🌳
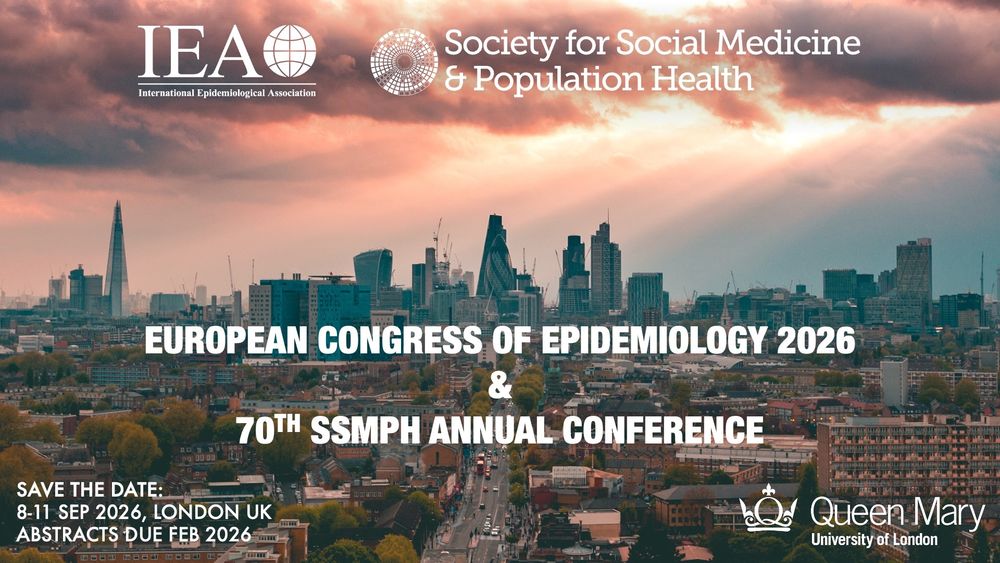
SAVE THE DATE: The 2026 IEA European Congress of Epidemiology and 70th @socsocmed.bsky.social Annual Conference will take place in London, UK on 8th-11th September 2026!
#EpiSky #EuroEpi2026
#EpiSky #EuroEpi2026
July 24, 2025 at 10:18 AM
SAVE THE DATE: The 2026 IEA European Congress of Epidemiology and 70th @socsocmed.bsky.social Annual Conference will take place in London, UK on 8th-11th September 2026!
#EpiSky #EuroEpi2026
#EpiSky #EuroEpi2026
Reposted by Meg Forrest 🌳🌲🌳

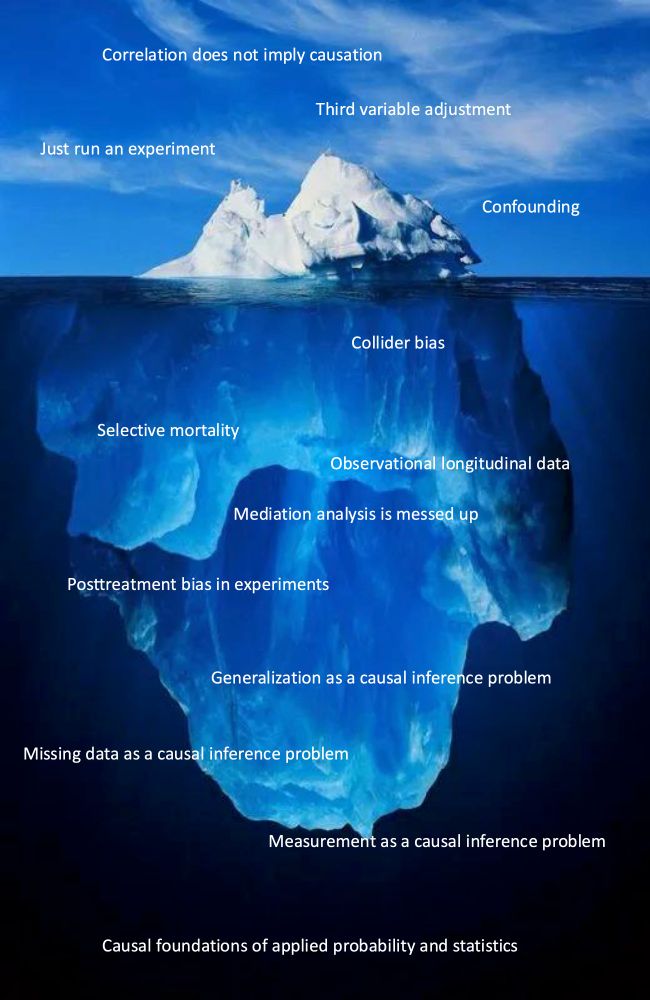
Causal inference iceberg!
What's missing?
What's missing?
February 26, 2025 at 1:40 PM
Causal inference iceberg!
What's missing?
What's missing?
Reposted by Meg Forrest 🌳🌲🌳
Before #CausalInferenceIntro:
"Hmm, this association looks unusual" 🤔
After #CausalInferenceIntro:
"Have you considered the possibility of collider bias?" 🤓
@pwgtennant.bsky.social @georgiatomova.bsky.social @jlrohmann.bsky.social @meghanforr.bsky.social
@laurieberrie.bsky.social
Rodrigo
"Hmm, this association looks unusual" 🤔
After #CausalInferenceIntro:
"Have you considered the possibility of collider bias?" 🤓
@pwgtennant.bsky.social @georgiatomova.bsky.social @jlrohmann.bsky.social @meghanforr.bsky.social
@laurieberrie.bsky.social
Rodrigo
July 12, 2025 at 5:39 AM
Before #CausalInferenceIntro:
"Hmm, this association looks unusual" 🤔
After #CausalInferenceIntro:
"Have you considered the possibility of collider bias?" 🤓
@pwgtennant.bsky.social @georgiatomova.bsky.social @jlrohmann.bsky.social @meghanforr.bsky.social
@laurieberrie.bsky.social
Rodrigo
"Hmm, this association looks unusual" 🤔
After #CausalInferenceIntro:
"Have you considered the possibility of collider bias?" 🤓
@pwgtennant.bsky.social @georgiatomova.bsky.social @jlrohmann.bsky.social @meghanforr.bsky.social
@laurieberrie.bsky.social
Rodrigo
Reposted by Meg Forrest 🌳🌲🌳
70 people having a curry at the amazing Bengal Brasserie restaurant in Leeds City Centre!
My favourite part of the #CausalIntroCourse!
My favourite part of the #CausalIntroCourse!

July 10, 2025 at 7:24 PM
70 people having a curry at the amazing Bengal Brasserie restaurant in Leeds City Centre!
My favourite part of the #CausalIntroCourse!
My favourite part of the #CausalIntroCourse!
Reposted by Meg Forrest 🌳🌲🌳
I *love* teaching collider bias with dice. And seeing the shocked (and angry) faces when the (seemingly) paradoxical results are revealed 😂
#EpiSky #CausalSky
#EpiSky #CausalSky

No one teaches collider bias like @pwgtennant.bsky.social in the #CausalIntroCourse.
Lighthearted dice rolling 🎲 before the big reveal. Puzzled looks. Then 🤯 shock, as the implications for their research fields sank in. You could hear a pin drop during the compelling lecture that followed! 👏🏻
Lighthearted dice rolling 🎲 before the big reveal. Puzzled looks. Then 🤯 shock, as the implications for their research fields sank in. You could hear a pin drop during the compelling lecture that followed! 👏🏻
July 10, 2025 at 8:13 AM
I *love* teaching collider bias with dice. And seeing the shocked (and angry) faces when the (seemingly) paradoxical results are revealed 😂
#EpiSky #CausalSky
#EpiSky #CausalSky
Reposted by Meg Forrest 🌳🌲🌳
I love the Monday evening social! 😎 #CausalIntroCourse

July 7, 2025 at 6:07 PM
I love the Monday evening social! 😎 #CausalIntroCourse
Reposted by Meg Forrest 🌳🌲🌳

We are very excited to be welcoming 1500 epidemiologists to Boston, next week for our conference!
Share your plans, and connect with other delegates, on LinkedIn or Bluesky using the #SER2025 hashtag or via the Whova conference app.
We are looking forward to seeing you all very soon!
#EpiSky
Share your plans, and connect with other delegates, on LinkedIn or Bluesky using the #SER2025 hashtag or via the Whova conference app.
We are looking forward to seeing you all very soon!
#EpiSky

June 3, 2025 at 12:25 PM
Reposted by Meg Forrest 🌳🌲🌳

NEXT TALK: We're excited to be joined next week by Martin Lajous, who will be presenting "Estimating effects on all-cause mortality in the presence of COVID-19 deaths"
📅 May 7, 2025
🕓 4pm CEST (Berlin time)
📍 hybrid (Charité Mitte or Zoom)
Registration links 👇
📅 May 7, 2025
🕓 4pm CEST (Berlin time)
📍 hybrid (Charité Mitte or Zoom)
Registration links 👇

May 2, 2025 at 1:55 PM
NEXT TALK: We're excited to be joined next week by Martin Lajous, who will be presenting "Estimating effects on all-cause mortality in the presence of COVID-19 deaths"
📅 May 7, 2025
🕓 4pm CEST (Berlin time)
📍 hybrid (Charité Mitte or Zoom)
Registration links 👇
📅 May 7, 2025
🕓 4pm CEST (Berlin time)
📍 hybrid (Charité Mitte or Zoom)
Registration links 👇
We ♥️ Methods!
This afternoon, Corinna Dressler and I will host our talk “Evidence Synthesis: Types, reproducibility, and best practices“
⏰ 3 pm Berlin CET (9am US EST)
📍online (Zoom)
Info + registration: www.bihealth.org/de/aktuell/l...
#LoveMethods2025
#systematicreview #scopingreview #ebm
This afternoon, Corinna Dressler and I will host our talk “Evidence Synthesis: Types, reproducibility, and best practices“
⏰ 3 pm Berlin CET (9am US EST)
📍online (Zoom)
Info + registration: www.bihealth.org/de/aktuell/l...
#LoveMethods2025
#systematicreview #scopingreview #ebm
February 28, 2025 at 7:50 AM
We ♥️ Methods!
This afternoon, Corinna Dressler and I will host our talk “Evidence Synthesis: Types, reproducibility, and best practices“
⏰ 3 pm Berlin CET (9am US EST)
📍online (Zoom)
Info + registration: www.bihealth.org/de/aktuell/l...
#LoveMethods2025
#systematicreview #scopingreview #ebm
This afternoon, Corinna Dressler and I will host our talk “Evidence Synthesis: Types, reproducibility, and best practices“
⏰ 3 pm Berlin CET (9am US EST)
📍online (Zoom)
Info + registration: www.bihealth.org/de/aktuell/l...
#LoveMethods2025
#systematicreview #scopingreview #ebm
📣 New paper!
We investigated the use of stacked proportional bar graphs (aka "Grotta bars") in observational neurology research & made infographics 🎨📊 to guide proper use & interpretation of these figures.
🔓 Read the OA paper: www.neurology.org/doi/10.1212/...
🙈 Spoilers below 👇
We investigated the use of stacked proportional bar graphs (aka "Grotta bars") in observational neurology research & made infographics 🎨📊 to guide proper use & interpretation of these figures.
🔓 Read the OA paper: www.neurology.org/doi/10.1212/...
🙈 Spoilers below 👇
Neurology® Journals
www.neurology.org
February 6, 2025 at 4:08 PM
📣 New paper!
We investigated the use of stacked proportional bar graphs (aka "Grotta bars") in observational neurology research & made infographics 🎨📊 to guide proper use & interpretation of these figures.
🔓 Read the OA paper: www.neurology.org/doi/10.1212/...
🙈 Spoilers below 👇
We investigated the use of stacked proportional bar graphs (aka "Grotta bars") in observational neurology research & made infographics 🎨📊 to guide proper use & interpretation of these figures.
🔓 Read the OA paper: www.neurology.org/doi/10.1212/...
🙈 Spoilers below 👇
Happening now! Hope you can join for Vanessa Didelez's talk "Statistical Methods for Causal Inference with Time-to-Event Data in Epidemiology" @bemcolloquium.bsky.social
Registration: eu01web.zoom.us/webinar/regi...
Registration: eu01web.zoom.us/webinar/regi...
January 8, 2025 at 3:08 PM
Happening now! Hope you can join for Vanessa Didelez's talk "Statistical Methods for Causal Inference with Time-to-Event Data in Epidemiology" @bemcolloquium.bsky.social
Registration: eu01web.zoom.us/webinar/regi...
Registration: eu01web.zoom.us/webinar/regi...
It was such a nice visit!!
Great #EpiSky Christmas album cover from my recent visit to the Charité Institute of Public Health!
With
@georgiatomova.bsky.social,
@jlrohmann.bsky.social, @meghanforr.bsky.social, @chisatoito.bsky.social,
@rhuerta.bsky.social,
@mpiccininni3.bsky.social,
Toivo Glatz, and others)
With
@georgiatomova.bsky.social,
@jlrohmann.bsky.social, @meghanforr.bsky.social, @chisatoito.bsky.social,
@rhuerta.bsky.social,
@mpiccininni3.bsky.social,
Toivo Glatz, and others)
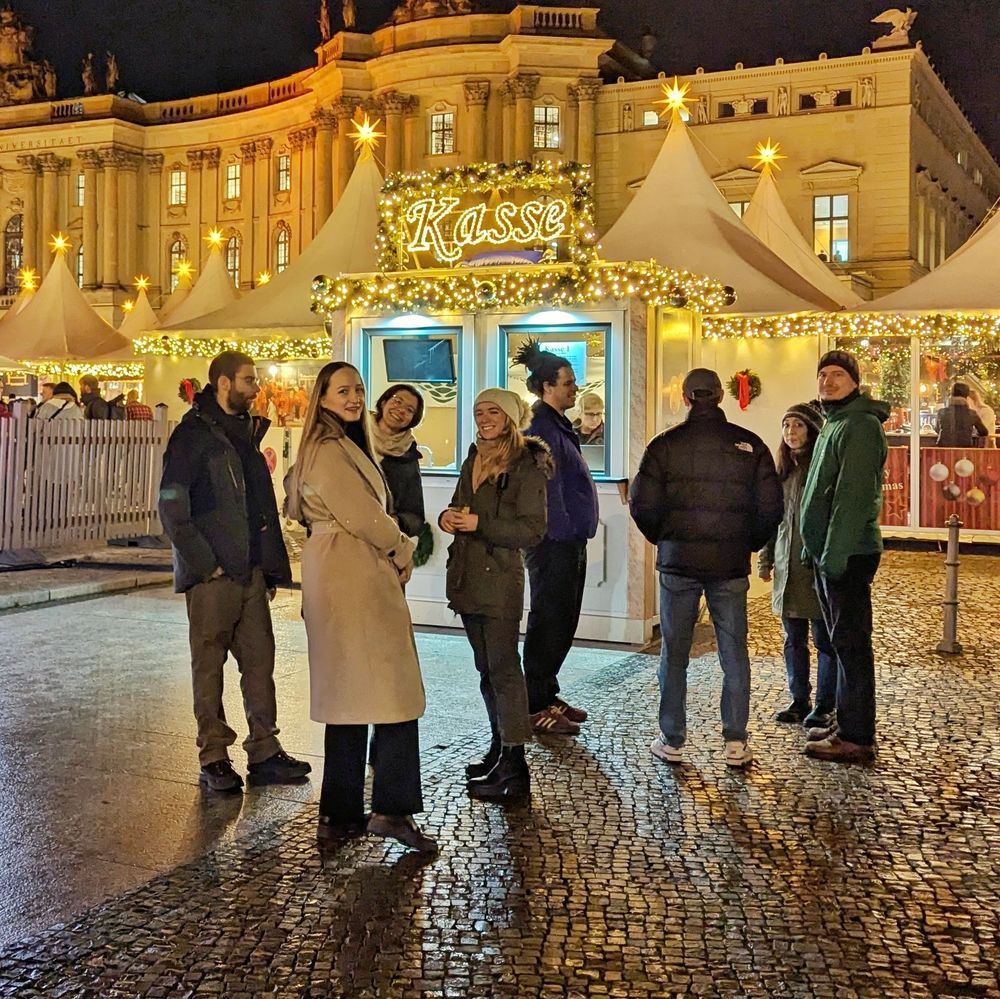
December 14, 2024 at 2:17 PM
It was such a nice visit!!
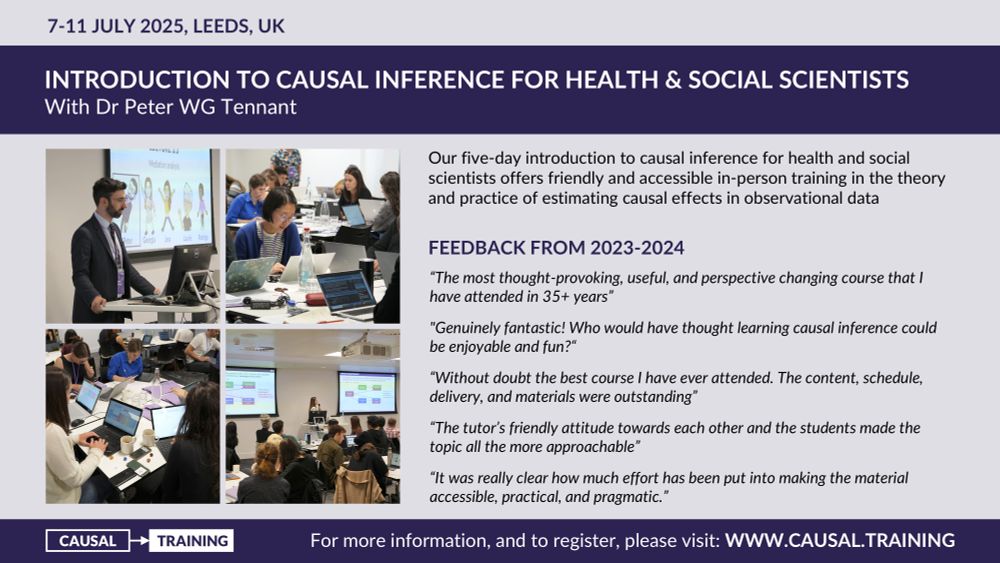
I was really lucky to have been able to participate in this class in January. It has a great program with great instructors!
Looks like spots are filling up quickly for the July 2025 course!
#EpiSky #CausalInference
Looks like spots are filling up quickly for the July 2025 course!
#EpiSky #CausalInference
PLEASE SHARE: Registration is now open for the next Introduction to Causal Inference Course for Health & Social Scientists (7-11 July 2025, Leeds, UK).
See more info & register here: www.causal.training
Note, we are not planning any other courses until 2027.
#CausalIntroCourse #EpiSky #CausalSky
See more info & register here: www.causal.training
Note, we are not planning any other courses until 2027.
#CausalIntroCourse #EpiSky #CausalSky
December 2, 2024 at 4:30 PM
I was really lucky to have been able to participate in this class in January. It has a great program with great instructors!
Looks like spots are filling up quickly for the July 2025 course!
#EpiSky #CausalInference
Looks like spots are filling up quickly for the July 2025 course!
#EpiSky #CausalInference
Reposted by Meg Forrest 🌳🌲🌳
We’re encouraging meaningful commentary with $1,000 rewards for selected PubPeer comments. bsky.app/profile/pubp...
Now imagine if @hhmi.bsky.social , NIH, NSF, etc also awarded outstanding public reviews.
These could boost careers and CVs while building a vital layer of scientific evaluation.
Now imagine if @hhmi.bsky.social , NIH, NSF, etc also awarded outstanding public reviews.
These could boost careers and CVs while building a vital layer of scientific evaluation.
And now for the announcement:
While many of our plans for the award funds will take time to implement, one can start immediately.
To thank our users and encourage scientific debate, we’re introducing $1,000 rewards for selected PubPeer comments!
Yes students and postdocs you read that right: $1000
While many of our plans for the award funds will take time to implement, one can start immediately.
To thank our users and encourage scientific debate, we’re introducing $1,000 rewards for selected PubPeer comments!
Yes students and postdocs you read that right: $1000
November 26, 2024 at 8:25 AM
We’re encouraging meaningful commentary with $1,000 rewards for selected PubPeer comments. bsky.app/profile/pubp...
Now imagine if @hhmi.bsky.social , NIH, NSF, etc also awarded outstanding public reviews.
These could boost careers and CVs while building a vital layer of scientific evaluation.
Now imagine if @hhmi.bsky.social , NIH, NSF, etc also awarded outstanding public reviews.
These could boost careers and CVs while building a vital layer of scientific evaluation.
Super stoked for this talk! Hope to see some of you there next week :)
#EpiSky #CausalInference #Epidemiology #AcademicSky #PublicHealth
#EpiSky #CausalInference #Epidemiology #AcademicSky #PublicHealth
Announcement: Next week, Georgia Tomova will present "Understanding compositional data with fixed and variable totals using DAGs and data simulations". @georgiatomova.bsky.social
🗓️ Wednesday, November 27
🕔 16:00 - 17:30 Berlin time
📍 Hybrid (Charité Mitte or Zoom)
Registration links 👇
#EpiSky
🗓️ Wednesday, November 27
🕔 16:00 - 17:30 Berlin time
📍 Hybrid (Charité Mitte or Zoom)
Registration links 👇
#EpiSky

November 21, 2024 at 5:31 PM
Super stoked for this talk! Hope to see some of you there next week :)
#EpiSky #CausalInference #Epidemiology #AcademicSky #PublicHealth
#EpiSky #CausalInference #Epidemiology #AcademicSky #PublicHealth