


Pete Vilter
@petevilter.me
Working on grid interconnection at Pearl Street Technologies. Prev databases and things at RelationalAI, Bubble, Cockroach.
https://petevilter.me
https://petevilter.me
Here's a power grid simulator (mostly vibecoded), showing two generators being dispatched to satisfy load changing over time. The cheaper generator (blue region) is dispatched first; the more expensive one (pink region) only when needed.
August 17, 2025 at 7:54 PM
Here's a power grid simulator (mostly vibecoded), showing two generators being dispatched to satisfy load changing over time. The cheaper generator (blue region) is dispatched first; the more expensive one (pink region) only when needed.
Used Claude Code to vibecode a UI for @duckdb.org in a few days. Here it is navigating foreign keys
August 3, 2025 at 4:37 AM
Used Claude Code to vibecode a UI for @duckdb.org in a few days. Here it is navigating foreign keys
Neat to see LLMs ingesting observability data and generating explanations www.honeycomb.io/blog/its-the...

It's The End Of Observability As We Know It (And I Feel Fine)
The history of observability tools over the past decade has been about a pretty simple concept, but LLMs bring the death of that paradigm.
www.honeycomb.io
June 11, 2025 at 1:34 AM
Neat to see LLMs ingesting observability data and generating explanations www.honeycomb.io/blog/its-the...
Distributed systems should feel like physical puzzles we can manipulate!
As an example, I modeled a bank in my simulator.
Without a lock, there's a race condition: if the two clients' gets and puts of the balance are interleaved, the same money can be withdrawn twice.
As an example, I modeled a bank in my simulator.
Without a lock, there's a race condition: if the two clients' gets and puts of the balance are interleaved, the same money can be withdrawn twice.
May 24, 2025 at 11:39 PM
Distributed systems should feel like physical puzzles we can manipulate!
As an example, I modeled a bank in my simulator.
Without a lock, there's a race condition: if the two clients' gets and puts of the balance are interleaved, the same money can be withdrawn twice.
As an example, I modeled a bank in my simulator.
Without a lock, there's a race condition: if the two clients' gets and puts of the balance are interleaved, the same money can be withdrawn twice.
I wish @vscode.dev had richer & more standardized support for profiling; maybe a "Profiler Adapter Protocol" along the lines of the Debug Adapter Protocol and LSP.
When running a multithreaded program under the debugger, I want to see live CPU usage for each thread, and click to get a flame graph.
When running a multithreaded program under the debugger, I want to see live CPU usage for each thread, and click to get a flame graph.
May 19, 2025 at 10:57 PM
I wish @vscode.dev had richer & more standardized support for profiling; maybe a "Profiler Adapter Protocol" along the lines of the Debug Adapter Protocol and LSP.
When running a multithreaded program under the debugger, I want to see live CPU usage for each thread, and click to get a flame graph.
When running a multithreaded program under the debugger, I want to see live CPU usage for each thread, and click to get a flame graph.
It's hard to wrap your head around all the failure modes of a distributed system.
What if you could play with the sequence diagram of a run to see how it responds, and see if you can get it into a failure state?
dist-sys-simulator.netlify.app
What if you could play with the sequence diagram of a run to see how it responds, and see if you can get it into a failure state?
dist-sys-simulator.netlify.app
April 13, 2025 at 5:19 PM
It's hard to wrap your head around all the failure modes of a distributed system.
What if you could play with the sequence diagram of a run to see how it responds, and see if you can get it into a failure state?
dist-sys-simulator.netlify.app
What if you could play with the sequence diagram of a run to see how it responds, and see if you can get it into a failure state?
dist-sys-simulator.netlify.app
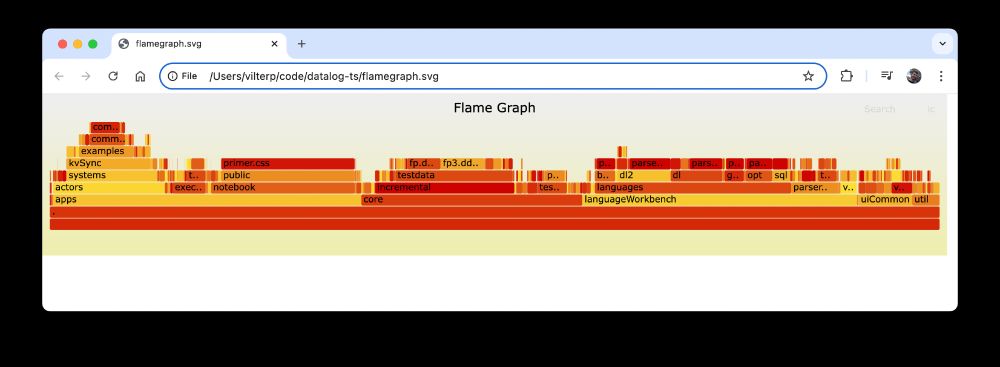
Little script to make a flamegraph of a codebase by lines of code github.com/vilterp/cloc...
December 26, 2024 at 4:08 PM
Little script to make a flamegraph of a codebase by lines of code github.com/vilterp/cloc...
Am I becoming a fintech person? 😂
Added a simulation of a commodity market to my distributed system simulator.
Clients submit buy and sell orders (blue/right and orange/left, respectively); the server uses DB triggers to execute a trade when there's a match.
Added a simulation of a commodity market to my distributed system simulator.
Clients submit buy and sell orders (blue/right and orange/left, respectively); the server uses DB triggers to execute a trade when there's a match.
November 25, 2024 at 2:54 AM
Am I becoming a fintech person? 😂
Added a simulation of a commodity market to my distributed system simulator.
Clients submit buy and sell orders (blue/right and orange/left, respectively); the server uses DB triggers to execute a trade when there's a match.
Added a simulation of a commodity market to my distributed system simulator.
Clients submit buy and sell orders (blue/right and orange/left, respectively); the server uses DB triggers to execute a trade when there's a match.