


Newcastle Air Quality
@sensors.spaceforheaton.com
Daily posts from precision air quality monitors situated around Newcastle upon Tyne and Gateshead.
Posts by @spaceforheaton.com
Posts by @spaceforheaton.com
Pinned


The sensor locations are:
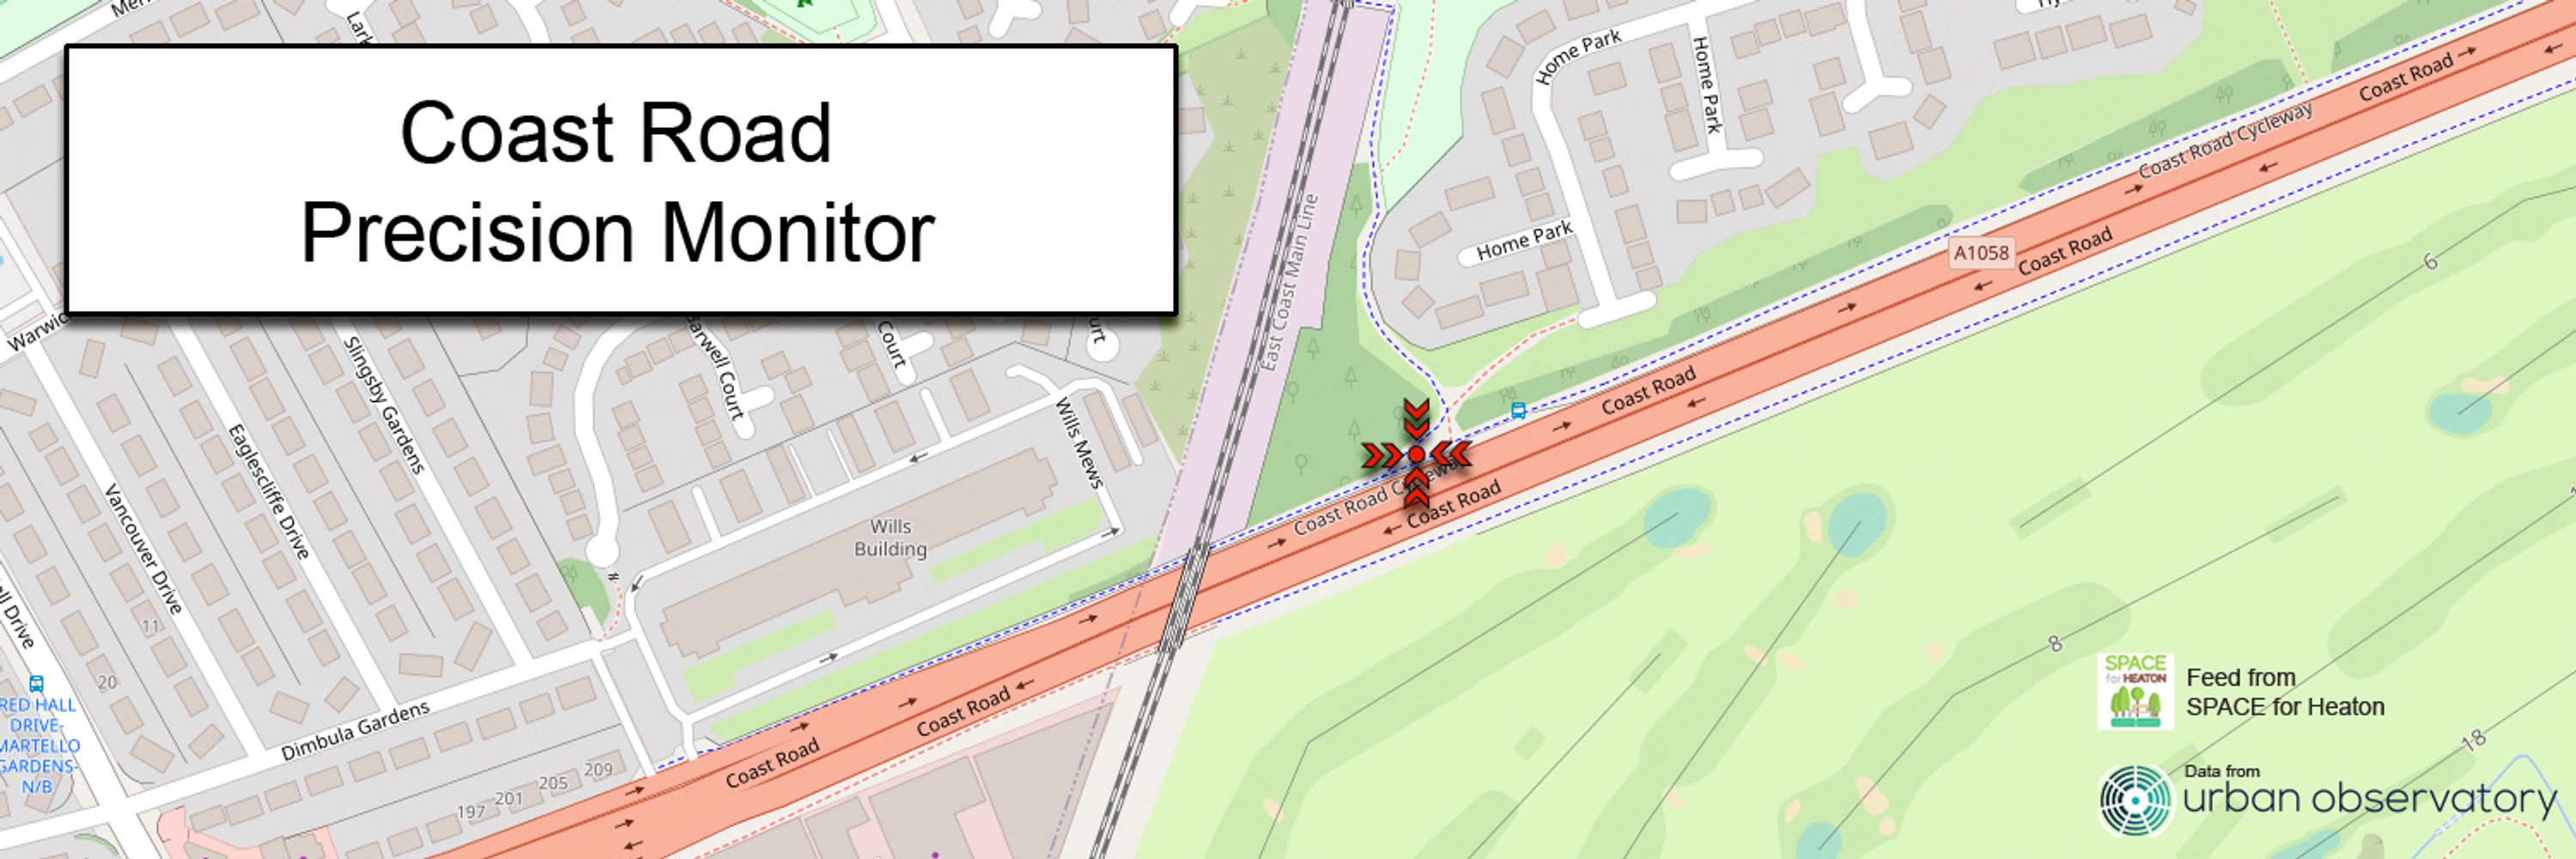
Coast Road: North of the carriageway just east of the railway bridge.
Cradlewell: North side of Jesmond Road, outside Kwik Fit.
Gosforth: East side of the of the High Street at its junction with Salters Road.
Tyne Bridge: South end of the bridge, just north of the railway.
Coast Road: North of the carriageway just east of the railway bridge.
Cradlewell: North side of Jesmond Road, outside Kwik Fit.
Gosforth: East side of the of the High Street at its junction with Salters Road.
Tyne Bridge: South end of the bridge, just north of the railway.
24h average NO2 readings for Wed 14th Jan 2026
Gosforth: 27.34µg/m³
Coast Road: 48.61µg/m³
Tyne Bridge: 37.56µg/m³
Chillingham Rd School: 70.35µg/m³
https://sensors.spaceforheaton.com
Gosforth: 27.34µg/m³
Coast Road: 48.61µg/m³
Tyne Bridge: 37.56µg/m³
Chillingham Rd School: 70.35µg/m³
https://sensors.spaceforheaton.com


January 15, 2026 at 8:30 AM
24h average NO2 readings for Wed 14th Jan 2026
Gosforth: 27.34µg/m³
Coast Road: 48.61µg/m³
Tyne Bridge: 37.56µg/m³
Chillingham Rd School: 70.35µg/m³
https://sensors.spaceforheaton.com
Gosforth: 27.34µg/m³
Coast Road: 48.61µg/m³
Tyne Bridge: 37.56µg/m³
Chillingham Rd School: 70.35µg/m³
https://sensors.spaceforheaton.com
24h average NO2 readings for Tue 13th Jan 2026
Gosforth: 14.17µg/m³
Coast Road: 40.76µg/m³
Tyne Bridge: 23.58µg/m³
Chillingham Rd School: 63.75µg/m³
https://sensors.spaceforheaton.com
Gosforth: 14.17µg/m³
Coast Road: 40.76µg/m³
Tyne Bridge: 23.58µg/m³
Chillingham Rd School: 63.75µg/m³
https://sensors.spaceforheaton.com


January 14, 2026 at 8:30 AM
24h average NO2 readings for Tue 13th Jan 2026
Gosforth: 14.17µg/m³
Coast Road: 40.76µg/m³
Tyne Bridge: 23.58µg/m³
Chillingham Rd School: 63.75µg/m³
https://sensors.spaceforheaton.com
Gosforth: 14.17µg/m³
Coast Road: 40.76µg/m³
Tyne Bridge: 23.58µg/m³
Chillingham Rd School: 63.75µg/m³
https://sensors.spaceforheaton.com
24h average NO2 readings for Mon 12th Jan 2026
Gosforth: 16.51µg/m³
Coast Road: 37.72µg/m³
Tyne Bridge: 23.29µg/m³
Chillingham Rd School: 59.83µg/m³
https://sensors.spaceforheaton.com
Gosforth: 16.51µg/m³
Coast Road: 37.72µg/m³
Tyne Bridge: 23.29µg/m³
Chillingham Rd School: 59.83µg/m³
https://sensors.spaceforheaton.com


January 13, 2026 at 8:30 AM
24h average NO2 readings for Mon 12th Jan 2026
Gosforth: 16.51µg/m³
Coast Road: 37.72µg/m³
Tyne Bridge: 23.29µg/m³
Chillingham Rd School: 59.83µg/m³
https://sensors.spaceforheaton.com
Gosforth: 16.51µg/m³
Coast Road: 37.72µg/m³
Tyne Bridge: 23.29µg/m³
Chillingham Rd School: 59.83µg/m³
https://sensors.spaceforheaton.com
24h average NO2 readings for Sun 11th Jan 2026
Gosforth: 15.43µg/m³
Coast Road: 21.47µg/m³
Tyne Bridge: 16.71µg/m³
Chillingham Rd School: 46.52µg/m³
https://sensors.spaceforheaton.com
Gosforth: 15.43µg/m³
Coast Road: 21.47µg/m³
Tyne Bridge: 16.71µg/m³
Chillingham Rd School: 46.52µg/m³
https://sensors.spaceforheaton.com


January 12, 2026 at 8:30 AM
24h average NO2 readings for Sun 11th Jan 2026
Gosforth: 15.43µg/m³
Coast Road: 21.47µg/m³
Tyne Bridge: 16.71µg/m³
Chillingham Rd School: 46.52µg/m³
https://sensors.spaceforheaton.com
Gosforth: 15.43µg/m³
Coast Road: 21.47µg/m³
Tyne Bridge: 16.71µg/m³
Chillingham Rd School: 46.52µg/m³
https://sensors.spaceforheaton.com
24h average NO2 readings for Sat 10th Jan 2026
Gosforth: 35.64µg/m³
Coast Road: 48.25µg/m³
Tyne Bridge: 38.67µg/m³
https://sensors.spaceforheaton.com
Gosforth: 35.64µg/m³
Coast Road: 48.25µg/m³
Tyne Bridge: 38.67µg/m³
https://sensors.spaceforheaton.com


January 11, 2026 at 8:30 AM
24h average NO2 readings for Sat 10th Jan 2026
Gosforth: 35.64µg/m³
Coast Road: 48.25µg/m³
Tyne Bridge: 38.67µg/m³
https://sensors.spaceforheaton.com
Gosforth: 35.64µg/m³
Coast Road: 48.25µg/m³
Tyne Bridge: 38.67µg/m³
https://sensors.spaceforheaton.com
24h average NO2 readings for Fri 9th Jan 2026
Gosforth: 32.67µg/m³
Coast Road: 25.54µg/m³
Tyne Bridge: 32.95µg/m³
https://sensors.spaceforheaton.com
Gosforth: 32.67µg/m³
Coast Road: 25.54µg/m³
Tyne Bridge: 32.95µg/m³
https://sensors.spaceforheaton.com


January 10, 2026 at 8:30 AM
24h average NO2 readings for Fri 9th Jan 2026
Gosforth: 32.67µg/m³
Coast Road: 25.54µg/m³
Tyne Bridge: 32.95µg/m³
https://sensors.spaceforheaton.com
Gosforth: 32.67µg/m³
Coast Road: 25.54µg/m³
Tyne Bridge: 32.95µg/m³
https://sensors.spaceforheaton.com
24h average NO2 readings for Thu 8th Jan 2026
Gosforth: 42.94µg/m³
Coast Road: 49.21µg/m³
Tyne Bridge: 54.56µg/m³
https://sensors.spaceforheaton.com
Gosforth: 42.94µg/m³
Coast Road: 49.21µg/m³
Tyne Bridge: 54.56µg/m³
https://sensors.spaceforheaton.com


January 9, 2026 at 8:30 AM
24h average NO2 readings for Thu 8th Jan 2026
Gosforth: 42.94µg/m³
Coast Road: 49.21µg/m³
Tyne Bridge: 54.56µg/m³
https://sensors.spaceforheaton.com
Gosforth: 42.94µg/m³
Coast Road: 49.21µg/m³
Tyne Bridge: 54.56µg/m³
https://sensors.spaceforheaton.com
24h average NO2 readings for Wed 7th Jan 2026
Gosforth: 9.19µg/m³
Coast Road: 16.02µg/m³
Tyne Bridge: 16.01µg/m³
https://sensors.spaceforheaton.com
Gosforth: 9.19µg/m³
Coast Road: 16.02µg/m³
Tyne Bridge: 16.01µg/m³
https://sensors.spaceforheaton.com


January 8, 2026 at 8:30 AM
24h average NO2 readings for Wed 7th Jan 2026
Gosforth: 9.19µg/m³
Coast Road: 16.02µg/m³
Tyne Bridge: 16.01µg/m³
https://sensors.spaceforheaton.com
Gosforth: 9.19µg/m³
Coast Road: 16.02µg/m³
Tyne Bridge: 16.01µg/m³
https://sensors.spaceforheaton.com
24h average NO2 readings for Tue 6th Jan 2026
Gosforth: 27.63µg/m³
Coast Road: 48µg/m³
Tyne Bridge: 35.45µg/m³
https://sensors.spaceforheaton.com
Gosforth: 27.63µg/m³
Coast Road: 48µg/m³
Tyne Bridge: 35.45µg/m³
https://sensors.spaceforheaton.com


January 7, 2026 at 8:30 AM
24h average NO2 readings for Tue 6th Jan 2026
Gosforth: 27.63µg/m³
Coast Road: 48µg/m³
Tyne Bridge: 35.45µg/m³
https://sensors.spaceforheaton.com
Gosforth: 27.63µg/m³
Coast Road: 48µg/m³
Tyne Bridge: 35.45µg/m³
https://sensors.spaceforheaton.com
24h average NO2 readings for Mon 5th Jan 2026
Gosforth: 13.29µg/m³
Coast Road: 19.55µg/m³
Tyne Bridge: 22.7µg/m³
https://sensors.spaceforheaton.com
Gosforth: 13.29µg/m³
Coast Road: 19.55µg/m³
Tyne Bridge: 22.7µg/m³
https://sensors.spaceforheaton.com


January 6, 2026 at 8:30 AM
24h average NO2 readings for Mon 5th Jan 2026
Gosforth: 13.29µg/m³
Coast Road: 19.55µg/m³
Tyne Bridge: 22.7µg/m³
https://sensors.spaceforheaton.com
Gosforth: 13.29µg/m³
Coast Road: 19.55µg/m³
Tyne Bridge: 22.7µg/m³
https://sensors.spaceforheaton.com
24h average NO2 readings for Sun 4th Jan 2026
Gosforth: 10.83µg/m³
Coast Road: 20.74µg/m³
Tyne Bridge: 12.78µg/m³
https://sensors.spaceforheaton.com
Gosforth: 10.83µg/m³
Coast Road: 20.74µg/m³
Tyne Bridge: 12.78µg/m³
https://sensors.spaceforheaton.com


January 5, 2026 at 8:30 AM
24h average NO2 readings for Sun 4th Jan 2026
Gosforth: 10.83µg/m³
Coast Road: 20.74µg/m³
Tyne Bridge: 12.78µg/m³
https://sensors.spaceforheaton.com
Gosforth: 10.83µg/m³
Coast Road: 20.74µg/m³
Tyne Bridge: 12.78µg/m³
https://sensors.spaceforheaton.com
24h average NO2 readings for Sat 3rd Jan 2026
Gosforth: 7.49µg/m³
Coast Road: 10.5µg/m³
Tyne Bridge: 13.87µg/m³
https://sensors.spaceforheaton.com
Gosforth: 7.49µg/m³
Coast Road: 10.5µg/m³
Tyne Bridge: 13.87µg/m³
https://sensors.spaceforheaton.com


January 4, 2026 at 8:30 AM
24h average NO2 readings for Sat 3rd Jan 2026
Gosforth: 7.49µg/m³
Coast Road: 10.5µg/m³
Tyne Bridge: 13.87µg/m³
https://sensors.spaceforheaton.com
Gosforth: 7.49µg/m³
Coast Road: 10.5µg/m³
Tyne Bridge: 13.87µg/m³
https://sensors.spaceforheaton.com
24h average NO2 readings for Fri 2nd Jan 2026
Gosforth: 7.42µg/m³
Coast Road: 15.48µg/m³
Tyne Bridge: 12.91µg/m³
https://sensors.spaceforheaton.com
Gosforth: 7.42µg/m³
Coast Road: 15.48µg/m³
Tyne Bridge: 12.91µg/m³
https://sensors.spaceforheaton.com


January 3, 2026 at 8:30 AM
24h average NO2 readings for Fri 2nd Jan 2026
Gosforth: 7.42µg/m³
Coast Road: 15.48µg/m³
Tyne Bridge: 12.91µg/m³
https://sensors.spaceforheaton.com
Gosforth: 7.42µg/m³
Coast Road: 15.48µg/m³
Tyne Bridge: 12.91µg/m³
https://sensors.spaceforheaton.com
24h average NO2 readings for Thu 1st Jan 2026
Gosforth: 4.9µg/m³
Coast Road: 9.58µg/m³
Tyne Bridge: 5.32µg/m³
https://sensors.spaceforheaton.com
Gosforth: 4.9µg/m³
Coast Road: 9.58µg/m³
Tyne Bridge: 5.32µg/m³
https://sensors.spaceforheaton.com


January 2, 2026 at 8:30 AM
24h average NO2 readings for Thu 1st Jan 2026
Gosforth: 4.9µg/m³
Coast Road: 9.58µg/m³
Tyne Bridge: 5.32µg/m³
https://sensors.spaceforheaton.com
Gosforth: 4.9µg/m³
Coast Road: 9.58µg/m³
Tyne Bridge: 5.32µg/m³
https://sensors.spaceforheaton.com
24h average NO2 readings for Wed 31st Dec 2025
Gosforth: 8.9µg/m³
Coast Road: 18.34µg/m³
Tyne Bridge: 12.73µg/m³
https://sensors.spaceforheaton.com
Gosforth: 8.9µg/m³
Coast Road: 18.34µg/m³
Tyne Bridge: 12.73µg/m³
https://sensors.spaceforheaton.com


January 1, 2026 at 8:30 AM
24h average NO2 readings for Wed 31st Dec 2025
Gosforth: 8.9µg/m³
Coast Road: 18.34µg/m³
Tyne Bridge: 12.73µg/m³
https://sensors.spaceforheaton.com
Gosforth: 8.9µg/m³
Coast Road: 18.34µg/m³
Tyne Bridge: 12.73µg/m³
https://sensors.spaceforheaton.com
24h average NO2 readings for Tue 30th Dec 2025
Gosforth: 15.38µg/m³
Coast Road: 18.37µg/m³
Tyne Bridge: 22.99µg/m³
https://sensors.spaceforheaton.com
Gosforth: 15.38µg/m³
Coast Road: 18.37µg/m³
Tyne Bridge: 22.99µg/m³
https://sensors.spaceforheaton.com


December 31, 2025 at 8:30 AM
24h average NO2 readings for Tue 30th Dec 2025
Gosforth: 15.38µg/m³
Coast Road: 18.37µg/m³
Tyne Bridge: 22.99µg/m³
https://sensors.spaceforheaton.com
Gosforth: 15.38µg/m³
Coast Road: 18.37µg/m³
Tyne Bridge: 22.99µg/m³
https://sensors.spaceforheaton.com
24h average NO2 readings for Mon 29th Dec 2025
Gosforth: 14.92µg/m³
Coast Road: 17.43µg/m³
Tyne Bridge: 17.41µg/m³
https://sensors.spaceforheaton.com
Gosforth: 14.92µg/m³
Coast Road: 17.43µg/m³
Tyne Bridge: 17.41µg/m³
https://sensors.spaceforheaton.com


December 30, 2025 at 8:30 AM
24h average NO2 readings for Mon 29th Dec 2025
Gosforth: 14.92µg/m³
Coast Road: 17.43µg/m³
Tyne Bridge: 17.41µg/m³
https://sensors.spaceforheaton.com
Gosforth: 14.92µg/m³
Coast Road: 17.43µg/m³
Tyne Bridge: 17.41µg/m³
https://sensors.spaceforheaton.com
24h average NO2 readings for Sun 28th Dec 2025
Gosforth: 20.61µg/m³
Coast Road: 16.53µg/m³
Tyne Bridge: 10.93µg/m³
https://sensors.spaceforheaton.com
Gosforth: 20.61µg/m³
Coast Road: 16.53µg/m³
Tyne Bridge: 10.93µg/m³
https://sensors.spaceforheaton.com


December 29, 2025 at 8:30 AM
24h average NO2 readings for Sun 28th Dec 2025
Gosforth: 20.61µg/m³
Coast Road: 16.53µg/m³
Tyne Bridge: 10.93µg/m³
https://sensors.spaceforheaton.com
Gosforth: 20.61µg/m³
Coast Road: 16.53µg/m³
Tyne Bridge: 10.93µg/m³
https://sensors.spaceforheaton.com
24h average NO2 readings for Sat 27th Dec 2025
Gosforth: 18.72µg/m³
Coast Road: 13.29µg/m³
Tyne Bridge: 16.2µg/m³
https://sensors.spaceforheaton.com
Gosforth: 18.72µg/m³
Coast Road: 13.29µg/m³
Tyne Bridge: 16.2µg/m³
https://sensors.spaceforheaton.com


December 28, 2025 at 8:30 AM
24h average NO2 readings for Sat 27th Dec 2025
Gosforth: 18.72µg/m³
Coast Road: 13.29µg/m³
Tyne Bridge: 16.2µg/m³
https://sensors.spaceforheaton.com
Gosforth: 18.72µg/m³
Coast Road: 13.29µg/m³
Tyne Bridge: 16.2µg/m³
https://sensors.spaceforheaton.com
24h average NO2 readings for Fri 26th Dec 2025
Grainger Street: 46.08µg/m³
Gosforth: 22.66µg/m³
Coast Road: 20.31µg/m³
Tyne Bridge: 13.84µg/m³
https://sensors.spaceforheaton.com
Grainger Street: 46.08µg/m³
Gosforth: 22.66µg/m³
Coast Road: 20.31µg/m³
Tyne Bridge: 13.84µg/m³
https://sensors.spaceforheaton.com


December 27, 2025 at 8:30 AM
24h average NO2 readings for Fri 26th Dec 2025
Grainger Street: 46.08µg/m³
Gosforth: 22.66µg/m³
Coast Road: 20.31µg/m³
Tyne Bridge: 13.84µg/m³
https://sensors.spaceforheaton.com
Grainger Street: 46.08µg/m³
Gosforth: 22.66µg/m³
Coast Road: 20.31µg/m³
Tyne Bridge: 13.84µg/m³
https://sensors.spaceforheaton.com
24h average NO2 readings for Thu 25th Dec 2025
Grainger Street: 21.59µg/m³
Gosforth: 9.93µg/m³
Coast Road: 13.68µg/m³
Tyne Bridge: 4.08µg/m³
https://sensors.spaceforheaton.com
Grainger Street: 21.59µg/m³
Gosforth: 9.93µg/m³
Coast Road: 13.68µg/m³
Tyne Bridge: 4.08µg/m³
https://sensors.spaceforheaton.com


December 26, 2025 at 8:30 AM
24h average NO2 readings for Thu 25th Dec 2025
Grainger Street: 21.59µg/m³
Gosforth: 9.93µg/m³
Coast Road: 13.68µg/m³
Tyne Bridge: 4.08µg/m³
https://sensors.spaceforheaton.com
Grainger Street: 21.59µg/m³
Gosforth: 9.93µg/m³
Coast Road: 13.68µg/m³
Tyne Bridge: 4.08µg/m³
https://sensors.spaceforheaton.com
24h average NO2 readings for Wed 24th Dec 2025
Gosforth: 24.49µg/m³
Coast Road: 32.49µg/m³
Tyne Bridge: 16.72µg/m³
https://sensors.spaceforheaton.com
Gosforth: 24.49µg/m³
Coast Road: 32.49µg/m³
Tyne Bridge: 16.72µg/m³
https://sensors.spaceforheaton.com


December 25, 2025 at 8:30 AM
24h average NO2 readings for Wed 24th Dec 2025
Gosforth: 24.49µg/m³
Coast Road: 32.49µg/m³
Tyne Bridge: 16.72µg/m³
https://sensors.spaceforheaton.com
Gosforth: 24.49µg/m³
Coast Road: 32.49µg/m³
Tyne Bridge: 16.72µg/m³
https://sensors.spaceforheaton.com
24h average NO2 readings for Tue 23rd Dec 2025
Gosforth: 27.42µg/m³
Coast Road: 32.77µg/m³
Tyne Bridge: 18.22µg/m³
https://sensors.spaceforheaton.com
Gosforth: 27.42µg/m³
Coast Road: 32.77µg/m³
Tyne Bridge: 18.22µg/m³
https://sensors.spaceforheaton.com


December 24, 2025 at 8:30 AM
24h average NO2 readings for Tue 23rd Dec 2025
Gosforth: 27.42µg/m³
Coast Road: 32.77µg/m³
Tyne Bridge: 18.22µg/m³
https://sensors.spaceforheaton.com
Gosforth: 27.42µg/m³
Coast Road: 32.77µg/m³
Tyne Bridge: 18.22µg/m³
https://sensors.spaceforheaton.com
24h average NO2 readings for Mon 22nd Dec 2025
Gosforth: 28.04µg/m³
Coast Road: 35.96µg/m³
Tyne Bridge: 24.46µg/m³
https://sensors.spaceforheaton.com
Gosforth: 28.04µg/m³
Coast Road: 35.96µg/m³
Tyne Bridge: 24.46µg/m³
https://sensors.spaceforheaton.com


December 23, 2025 at 8:30 AM
24h average NO2 readings for Mon 22nd Dec 2025
Gosforth: 28.04µg/m³
Coast Road: 35.96µg/m³
Tyne Bridge: 24.46µg/m³
https://sensors.spaceforheaton.com
Gosforth: 28.04µg/m³
Coast Road: 35.96µg/m³
Tyne Bridge: 24.46µg/m³
https://sensors.spaceforheaton.com
24h average NO2 readings for Sun 21st Dec 2025
Gosforth: 24.61µg/m³
Coast Road: 32.96µg/m³
Tyne Bridge: 24.02µg/m³
https://sensors.spaceforheaton.com
Gosforth: 24.61µg/m³
Coast Road: 32.96µg/m³
Tyne Bridge: 24.02µg/m³
https://sensors.spaceforheaton.com


December 22, 2025 at 8:30 AM
24h average NO2 readings for Sun 21st Dec 2025
Gosforth: 24.61µg/m³
Coast Road: 32.96µg/m³
Tyne Bridge: 24.02µg/m³
https://sensors.spaceforheaton.com
Gosforth: 24.61µg/m³
Coast Road: 32.96µg/m³
Tyne Bridge: 24.02µg/m³
https://sensors.spaceforheaton.com