Paul MC Smith
banner
wonderfulbooks.co.uk
Paul MC Smith
@wonderfulbooks.co.uk
210 followers 79 following 370 posts
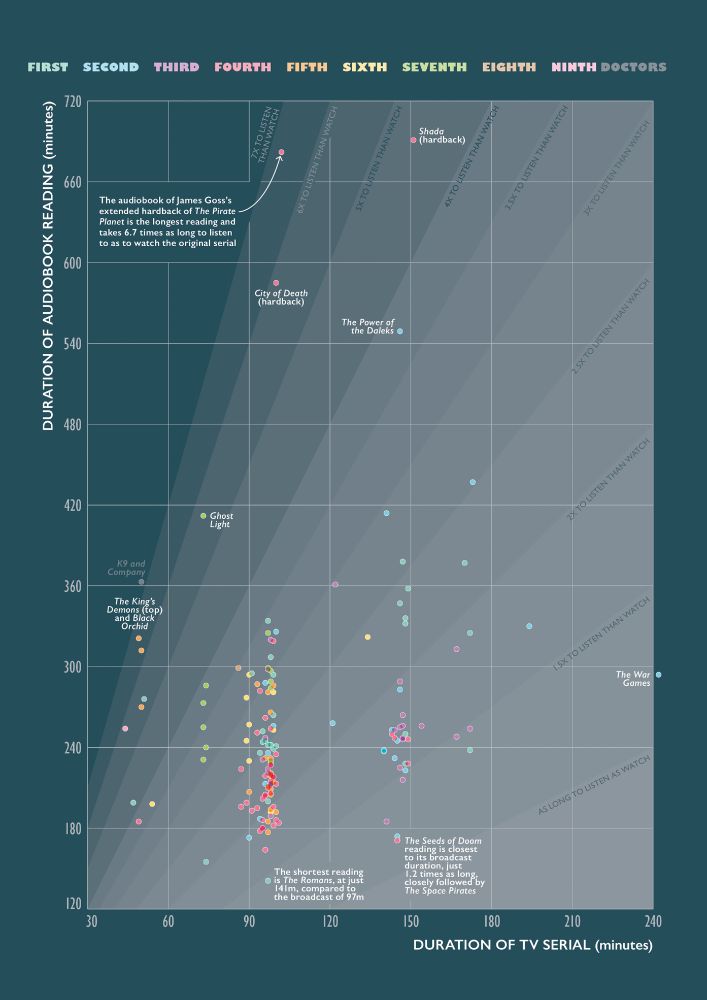
Design, data and Doctor Who. http://www.wonderfulbook.co.uk
Posts Media Videos Starter Packs
Amazing artistry
A bit of Pyramids art for your Monday...f
Reposted by Paul MC Smith
A big long post on Massacre in the Hills, the second Mounties novel by Terrance Dicks, featuring bucks, blizzards and - content warning - a racist 19th century term: 0tralala.blogspot.com/2025/11/mass...
Massacre in the Hills, by Terrance Dicks
0tralala.blogspot.com
Reposted by Paul MC Smith
It's November! Month of the Whonniversary, on which the Celestial Toyroom Annual 2026 from @dwasonline.bsky.social will be available in print. Celebrating the Fifth Doctor era with reviews and features, including a lovely piece by @thelightdreams.bsky.social about the show's electronic music.
Did the pupils denote the humanised Daleks, or am I just recalling a debunked fan theory?
Reposted by Paul MC Smith
On the first original, non Doctor Who book by Terrance Dicks: The Mounties - The Great March West (1976) 0tralala.blogspot.com/2025/10/the-...
The Great March West, by Terrance Dicks
0tralala.blogspot.com
Reposted by Paul MC Smith
Four weeks today the Celestial Toyroom Annual 2026 from @dwasonline.bsky.social will be available to buy in softback or (much nicer) hardback. Lots of good stuff celebrating the era of the Fifth Doctor. Designed by yours truly ☺️
True, though they're a small proportion of the runtime. And in that instance dwarfed by the amount of other stuff cut for the book!
Infographics are more than a nice picture with some numbers, or an illustrated list (a problem I had with DWM’s previous ‘Sufficient Data’ page). Done well they express data in a form that clarifies meaning and provides insight. Hang this poster with the cover art showing instead – they’re artful. 🔚
Ultimately this is a poor choice of dataset. The length of each book compared to its source is variable based on the whims of the author and the publisher’s indulgence. The audiobooks are then further randomised by who’s reading. There’s no correlation to express or underlying trend to tease out.
Whichever one finds more visually appealing is subjective, but these present the data in an objectively more precise and informative manner than the poster. That is just a jumble of colours with all but no expression of meaning. Such a wasted opportunity.
Plotting in story order reduces some clustering and makes finding specific titles easier. This also frees up colour to denote something other than Doctor. I tried year of publication but it showed no notable trend, so here it’s by author (though not sure that reveals much either).
But even taking the principles of the published chart – bubble ratios with largest at centre – there are more informative ways to present them. Here the distance from the centre is plotted relative to the ratio, with bands to make it clearer what this means.
Using squares retains the linear relationship. The height of the darker portion is the ratio of TV to book, while the widths are in proportion to audiobook duration. It’s easier to see where, for example, the audiobooks are double the length of the TV serial (11th row onwards).
Here are a couple of alternative treatments. Sticking with bubbles, arranging them in order of decreasing ratio makes the differences more apparent. A non-central alignment makes the ratio more apparent though still hard to compare areas.
We can also see that the least extended are largely Second, Third and Fourth Doctor tales – though perhaps a more useful colouring scheme would be by author, to show which were more or less prone to bulking up their word count.
The predominance of 4-parters does produce tight clustering, though, making titles hard to pick out. If it's the ratio of audio to visual that’s of main interest, then a bar chart is the clearest. Here the most extended are immediately clear, along with the uniformity of the bulk of the range.
Adding ratio bands shows the two Terence Dudley adaptations, while of comparative length to others, greatly extended their sub-hour scripts. And while The Romans is the shortest book, it adds proportionally more to its 4 parts than Seeds of Doom does to its 6.
It also highlights any outliers: the Douglas Adams tales whose book versions were based on longer draft scripts rather than the TV episodes; John Peel’s over-egging of The Power of the Daleks; how The War Games, though 10 episodes, gained only a standard length novelisation.
A better way to show the relation between pairs of numbers is to plot them on a scatter chart. This immediately shows the clusters around 2, 3, 4, 6 episodes that Classic Who stories were mostly produced as, and how this didn’t automatically produce novelisations of the same length.
While the bubbles are coloured by Doctor, these aren’t grouped by similar ratios, so there’s no way to see when or if a specific Doctor’s run might have had more extensive or succinct novelisations.
For example, the most disparate Seventh Doctor story is Ghost Light (audiobook 5.7x as long as the 3-part serial). Yet here Dragonfire (3.7) and Delta/Bannermen (3.3) are placed closer to the centre. Similarly, Sontaran Experiment (3.7) is more central than Shada (4.6).
It says the bubbles with the biggest difference are nearer the centre, and The Pirate Planet is roughly in the middle. But there’s no indication how or if another bubble’s distance from this is determined. There’s no sense of concentricity to the arrangement.