Aman Bhargava
@aman.bh
2.4K followers 710 following 370 posts
data/dev/design/map enthusiast Data viz and development @revisual.co, interned @graphics.reuters.com Bangalore, India #dataviz #rstats #svelte #maps 🔗 https://aman.bh
Posts Media Videos Starter Packs
Pinned
aman.bh
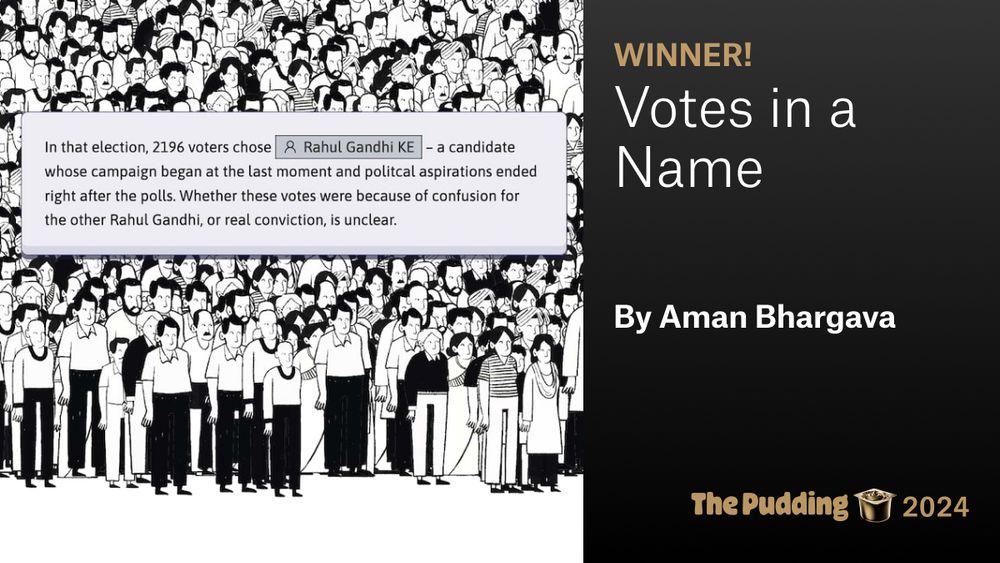
Well wow. This is my first award and I'm so happy it comes from people I've looked up to for many years, who are also a big reason I'm interested in all of this to begin with.

Have a read 🙂
aman.bh
But I mean this space has so many options, there's no one-true-way. However, worth looking into the micropub/sub situation and see if you're interested! indieweb.org is a massive rabbithole.
aman.bh
Awesome, is this a blog system rebuild? Just in case you're interested, I've been very into the micropub IndieWeb space and last month set up getindiekit.com on my VPS (just one of many micropub options). The nice part is that that site is installable as a PWA on my phone, so blogging on the go!
aman.bh
Legendary wayfinding.
aman.bh
This notebook + web code also means that if you got a similar CSV in the same format as our one, with some tweaks to the notebook and shapefiles you could get this page up and running for any city you want.
aman.bh
For analysis, we use #rstats and write stuff in R Markdown notebooks, which, unlike Jupyter notebooks, are plaintext and nicer (like, by a few hundred miles). Svelte for making the site, SveltePlot and D3 for making the interactive charts. All open-source: github.com/diagram-chas...
GitHub - diagram-chasing/blr-metro-ridership: Data analysis and visualization code for How Bangalore Uses the Metro
Data analysis and visualization code for How Bangalore Uses the Metro - diagram-chasing/blr-metro-ridership
github.com
aman.bh
Our analysis notebook lives in the same repo, where we can take in the CSV, do whatever we want with it (eg: prototype charts in ggplot), and output the condensed summary as a JSON. Interactive charts can read that data, and this can be kept up to date/changed without worry.
aman.bh
More skeuomorphic signs! HTML/CSS ftw, replicating their real-life counterparts.
aman.bh
This is probably the first time I've managed a network graph in a way I liked. I used workers to shift the simulation off the main thread so that the page doesn't lag while it sets up. More connections were on the same line, so we take a minimum number from both types of travel.
aman.bh
Same as above, I might know what the general map looks like but not specific "routes", so this was a custom routing system for handling interchanges, inter-line commutes. A virtualized list to show all 6k possible commutes so you can click at random ones quickly.
aman.bh
Not everyone's from Bangalore or might know where a specific station is (ik I don't), so instead of just name-dropping places, I reused our metro map component in a tooltip which shows the location of that station in a popover.
aman.bh
A thread of some design/code highlights for me from our 'How Bangalore Uses the Metro' 📊 project.

1. The header sign is fully HTML/CSS. 'Go Down Take Up For Toilet' is real signage at one of our biggest stations (pic below) :P
aman.bh
Thanks for taking the time to look :D
aman.bh
My favorite part is this routing system I built for visualizing pairs of commute trips. All this and more in the story!
aman.bh
Filed a Right to Information request with Bangalore's metro authority asking how many people traveled on the metro and got a file with 1.2M rows of data! We break our findings down in this story on how Bangalore uses the metro. w/
@vonter.bsky.social #dataviz

diagramchasing.fun/2025/how-ban...
Reposted by Aman Bhargava
jwolondon.bsky.social
A great post from @djnavarro.net, providing an accessible explanation of why statistics that can appear to reveal our ignorance may actually do the opposite. Makes excellent use of #datavis to provide visual support for the argument.

blog.djnavarro.net/posts/2025-0...
Some notes on probability judgement – Notes from a data witch
For the love of fuck, literally nobody thinks that 20% of the population is transgender. Please stop sharing that ridiculous YouGov statistic
blog.djnavarro.net
aman.bh
Experiments in visualizing crowds in Bangalore's metro station. The floor plans come in SVG formats, so I solved this by managing to constrain rendering clusters within a polygon with a certain color code (platform color is always consistent) :P
aman.bh
Thanks for sharing! Weekend watch is sorted
aman.bh
I really want to be excited about this but I can't wrap my head around the concepts (even remote functions) till I see a working prod example. If you do find any good ones, please share!
aman.bh
Thank you so much :)
aman.bh
Ty for boosting, good sir!!
aman.bh
OH THAT'S A SOLID IDEA!! I'll try 😁
aman.bh
Congratulations sean! CSS-only support sounds amazing.