Berkeley Earth
@berkeleyearth.org
1.1K followers 4 following 91 posts
We're an independent 501c3 non-profit organization working to make climate data open and accessible. 📍Berkeley, CA @ www.berkeleyearth.org 💲donate.berkeleyearth.org
Posts Media Videos Starter Packs
Pinned
berkeleyearth.org
Back with Our Monthly Press Briefing!

Join @rarohde.bsky.social, @hausfath.bsky.social, and the Berkeley Earth team on Wed 9/17 at 8am PDT / 5pm CET.
We’ll share updates from the August 2025 Temperature Report and discuss the latest global climate signals.

Register: us02web.zoom.us/webinar/regi...
Reposted by Berkeley Earth
rarohde.bsky.social
The Northern Pacific Ocean is currently smashing temperature records.

And it is reaching these levels far earlier than the current generation of climate models had expected.

A short thread 🧵
Time series of monthly Northern Pacific Ocean sea surface temperature anomalies from 1850 to August 2025 alongside multi-model expectations of the warming in this area (scenario SSP2-4.5).
berkeleyearth.org
Back with Our Monthly Press Briefing!

Join @rarohde.bsky.social, @hausfath.bsky.social, and the Berkeley Earth team on Wed 9/17 at 8am PDT / 5pm CET.
We’ll share updates from the August 2025 Temperature Report and discuss the latest global climate signals.

Register: us02web.zoom.us/webinar/regi...
Reposted by Berkeley Earth
rarohde.bsky.social
The open water route along through the Arctic Ocean along the Russian Coast opened in early August this year.

That puts it among the Top 5 earliest opening dates, though still weeks behind the record set in 2020.

Prior to 2005, such open water passages rarely occurred at all.
Chart showing the period during the satellite era when open water passages were present through the Arctic Ocean.  Open water passages are defined for this graphic as no more than 15% sea ice cover along a continuous path from the Atlantic to the Pacific.  Such passages are now routine, but rarely occurred prior to 2005. Sea ice concentration map in the Arctic Ocean for August 18th, 2025 from the National Snow and Ice Data Center.
Reposted by Berkeley Earth
hausfath.bsky.social
Happy to announce that I'll be serving as a lead author for Chapter 2 (titled "Large-scale changes in the climate system and their causes") of the upcoming IPCC 7th Assessment Report, alongside 21 other scientists from around the world: apps.ipcc.ch/report/...
Reposted by Berkeley Earth
rarohde.bsky.social
For all the sea ice nerds, NSIDC has announced a new version of the sea ice index that replaces SSMIS data with AMSR2 (starting Jan 1, 2025 and continuing for all future updates).

This new dataset was developed in response to the plans to kill SSMIS.

nsidc.org/data/user-re...
New version release: NOAA/NSIDC Sea Ice Index, Version 4 | National Snow and Ice Data Center
NOAA@NSIDC is pleased to announce the release of Sea Ice Index, Version 4.
nsidc.org
Reposted by Berkeley Earth
rarohde.bsky.social
In most of the world day-to-day weather variations are still much larger than long-term global warming.

As a result, both daily record highs and daily record lows remain common.

However as the world warms, new daily record highs consistently far outnumber new daily record lows.

🧪
Reposted by Berkeley Earth
zacklabe.com
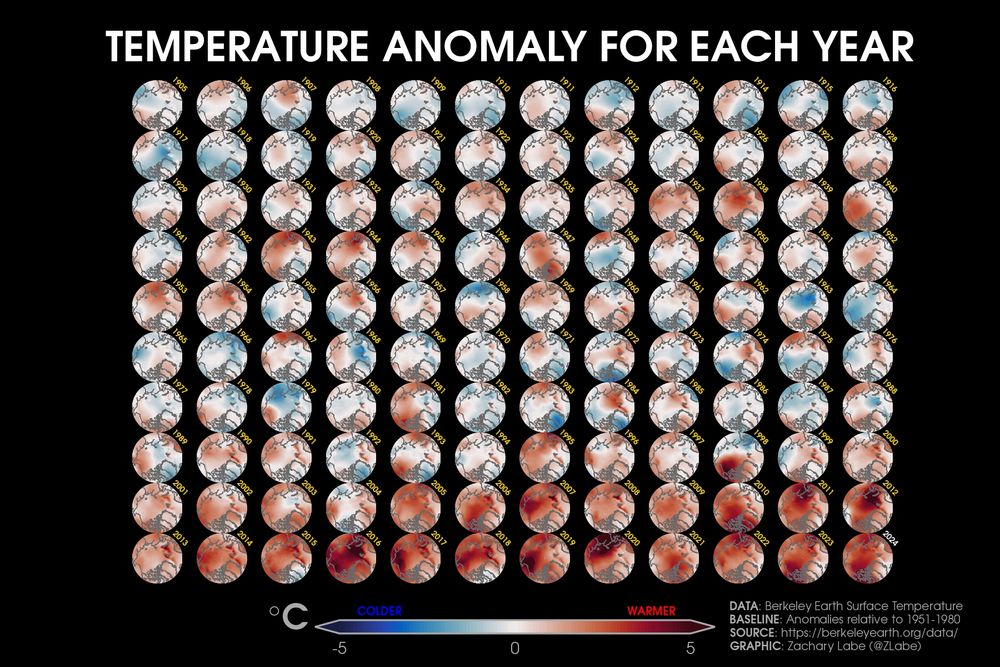
Annual #Arctic air temperature anomalies over the last 120 years...

Data from @berkeleyearth.org. Graphic by zacklabe.com/arctic-sea-i...
Visualization showing polar stereographic maps for each year from 1905 to 2024. There is substantial spatial variability and a long-term warming trend. Anomalies are computed in reference to a 1951-1980 climatological baseline.
berkeleyearth.org
The recent exceptional warming peak in 2023/2024 is dissipating, and near-term temperatures are expected to return closer to the long-term trend.

However, the rapid pace of man-made global warming is expected to continue, and more record years are inevitable.

12/
12-month moving average time series of global mean temperture anomalies from 1850-2025.
berkeleyearth.org
With six months completed, 2025 is very likely to finish as either the 2nd warmest (35% chance) or 3rd warmest (64% chance) year on record.

Following recent cooling, only a slight 1% chance of record warmth in 2025 remains.

11/
Time series of global annual average temperature anomalies for the period 1850-2024, relative to the 1850-1900 mean, as well as the predicted range of outcomes for 2025.
berkeleyearth.org
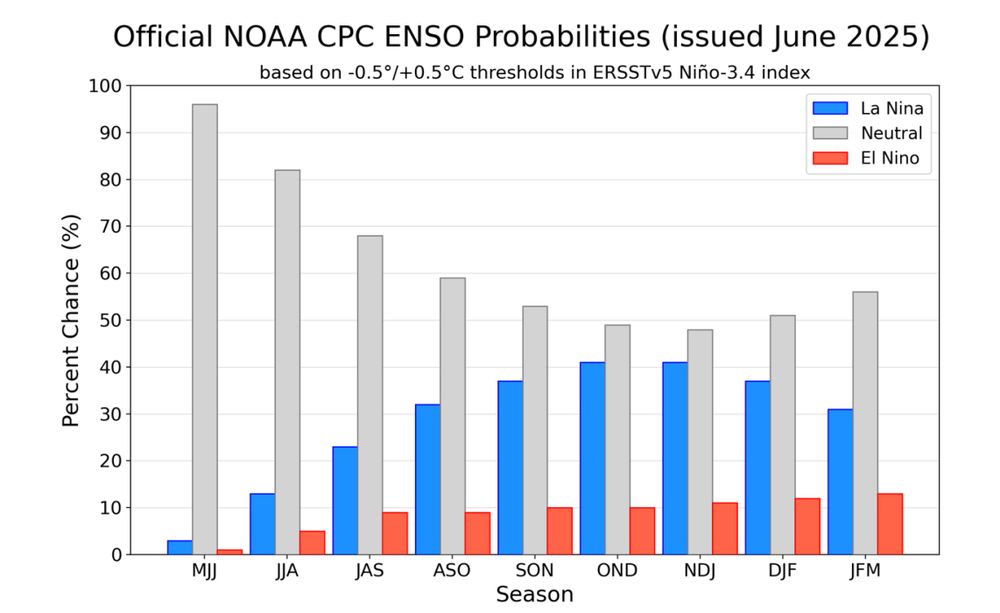
The Pacific Ocean remains in a neutral condition.

An ~50% chance exists that neutral conditions continue through the rest of the year, with a ~40% chance of La Niña returning late in the year, and only a modest chance of El Niño developing.

iri.columbia.edu/our-expertis...

10/
Forecast probabilities for El Nino, La Nina, and neutral states in the Pacific for the next several months.
berkeleyearth.org
The global ocean average has continued to cool since the El Niño related peak in 2023/2024.

Since April, the ocean average has fallen below the long-term trend. Modest additional cooling remains likely.

9/
Monthly ocean average temperature anomalies since 1980.
berkeleyearth.org
Relative to the long-term trend, June had one of the strongest temperature excursions on record in the Western Mediterranean.

A slightly larger excursion occurred in June 2003, preceding severe July & August heat waves that killed ~70,000 Europeans.

en.wikipedia.org/wiki/2003_Eu...

8/
Monthly average of temperature anomalies in the Western Mediterranean since 1850.
berkeleyearth.org
June 2025 saw record warmth in the Western Mediterranean Sea.

This pattern, associated with the June heat dome over Western Europe, may further promote strong heat waves in Europe during the rest of summer.

7/
Map of sea surface temperature anomalies in June 2025 in the Western Mediterranean.
berkeleyearth.org
A relatively modest 3% of the Earth's surface registered a locally record high monthly average during June 2025 (4% of oceans / 2% of land).

No significant areas had near record lows.

6/
Map of regions with record and near-record high and low temperatures in June 2025.
berkeleyearth.org
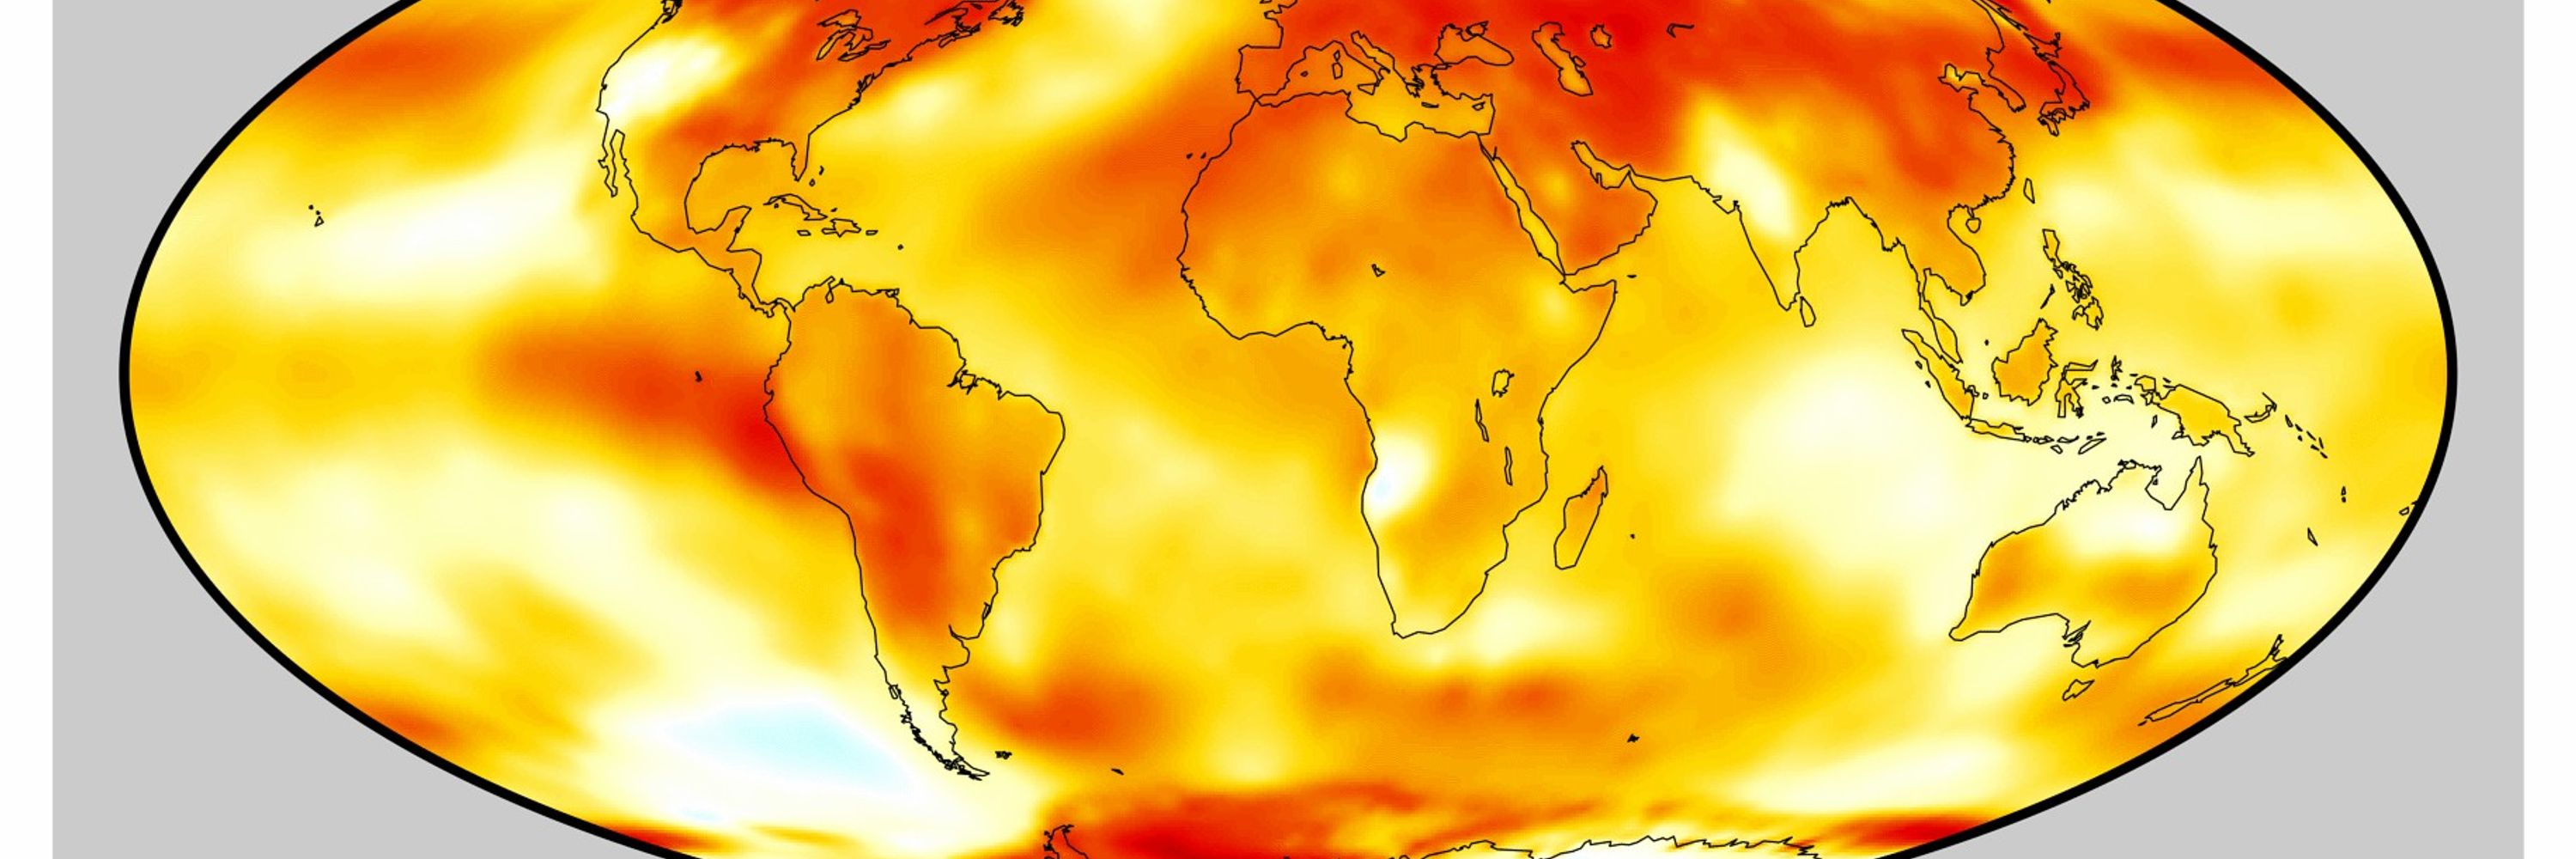
Spatially, warmth remained widespread in June 2025, though monthly average records were relatively rare.

Warmth was particularly noteworthy in Western Europe and Central Asia.

Unusual cooling was present in India, Australia, and S. America.

5/
Map of temperature anomalies in June 2025 relative to the average 1951-1980.
berkeleyearth.org
On land June 2025 was nearly identical to May 2025, continuing the sharp cooling observed last month.

Nevertheless, the land average was still the fifth warmest for June in the observational record.

4/
berkeleyearth.org
The relative cooling in May and June 2025 has fallen below the long-term trend line.

The exceptional warmth in 2023/2024 appears to have dissipated, and in the short-term we expect global means to stay closer to the long-term trend.

3/
Monthly time series of global mean temperature anomalies since 1980.
berkeleyearth.org
The global average temperature in June 2025 was 1.31 ± 0.10°C (2.36 ± 0.19 °F) above the 1850-1900 average, the 3rd warmest directly measured June.

This was only slightly cooler than May 2025, but is sharply lower than the first few months of 2025.

2/
Seasonally wrapped time series of global mean temperature anomalies showing each year since 1850.
berkeleyearth.org
Temperature Update for June 2025

Third warmest June in the instrumental record.

Similar conditions to May, but sharply cooler than earlier in 2025.

Neutral conditions in the Pacific.

2025 is very likely to be the 2nd or 3rd warmest year.

berkeleyearth.org/june-2025-te...

🧵
Time series of global mean temperature anomalies in June for 1850-2025
berkeleyearth.org
Join @rarohde.bsky.social, @hausfath.bsky.social and the Berkeley Earth team this Thurs 7/10 at 8am PDT/5pm CET for our next monthly press briefing featuring updates and insights from our June 2025 Temperature Update.

🔗 To register: us02web.zoom.us/webinar/regi...
Reposted by Berkeley Earth
rarohde.bsky.social
The Western Mediterranean has been record warm recently, shown here for the June averages from ERA5.

This much warmth in the Mediterranean may predict a brutally hot summer for Europe.

1/ 🧵🧪🌊
Map of sea surface temperature anomalies for June 2025 in the vicinity of Europe, showing exceptional warmth in the Western Mediterranean.
Reposted by Berkeley Earth
rarohde.bsky.social
Berkeley Earth's next monthly climate briefing, looking back on June temperatures, will be held online on July 10th at 8 AM PT / 11 AM ET / 5 PM CET.

us02web.zoom.us/webinar/regi...

It's open for anyone, but geared toward the news media.

See you there.
Title card announcing the July Monthly Climate Briefing