Tomer Burg
@burgwx.bsky.social
6.9K followers 160 following 1K posts
Senior meteorological scientist at @windbornewx.bsky.social & web developer
Posts Media Videos Starter Packs
Pinned
burgwx.bsky.social
Website note - issues with the JTWC data source I use prevented updates for the last few days on West Pacific storms. I coded a workaround fix from multiple data sources and data should be flowing in now. Apologies for any inconvenience.

polarwx.com/tropical/
burgwx.bsky.social
So back to this post - what makes this shortwave trough special?

Nothing really. It's just a manifestation of the "butterfly effect" - the impact of most perturbations stays fairly local, but given the right circumstances, a small perturbation can rapidly grow downstream.
burgwx.bsky.social
Tracing back the source of the uncertainty source leads us to a fairly unremarkable shortwave over Canada - but which happens to be at an extremely sensitive inflection point.

Slightly faster -> stays embedded in waveguide up north
Slightly slower -> detaches from waveguide & drifts to Great Lakes
burgwx.bsky.social
Now let's look at the scenario where the shortwave trough is slightly slower & detaches from the jet.

The amplifying ridge to its west forces it southward, where it phases with the SE US coastal low and pulls it north into NJ/NYC/New England.
burgwx.bsky.social
Let's look at what happens in the scenario where the shortwave trough is slightly faster and fails to detach from the waveguide.

The SE US coastal low ends up just meandering in place over the Carolinas as a ridge quickly builds to its north - rain-starved New England stays dry.
burgwx.bsky.social
Tracing back the source of the uncertainty source leads us to a fairly unremarkable shortwave over Canada - but which happens to be at an extremely sensitive inflection point.

Slightly faster -> stays embedded in waveguide up north
Slightly slower -> detaches from waveguide & drifts to Great Lakes
burgwx.bsky.social
Your next thought might be to look at AI weather models, since those have certain advantages over NWP models.

But even they are experiencing the same whiplash - notice how the AIFS over the last few runs keeps alternating between cutoff & no cutoff low in the Great Lakes:
burgwx.bsky.social
[Thread] Following along with the NE US weekend forecast & wondering why models are all over the place with the nor'easter?

Here's a good place to start: notice how a potent cutoff low in the 12z ECMWF is completely missing in the following 18z ECMWF run - only 96 hours out!
burgwx.bsky.social
On the technical side - normally, we'd have files called "a-decks" contain all the relevant deterministic & ensemble model data. This year, those files have not provided data for most models, requiring those of us generating these plots to look elsewhere for the raw data.
burgwx.bsky.social
For those tracking realtime tropical cyclones, this year's JTWC data dissemination issues have been quite challenging to say the least.

This plot may look simple, but "under the hood" this stitches together data from numerous sources & tracking algorithms.
burgwx.bsky.social
Now that the data is backfilled, the deterministic AIFS did quite well with Typhoon Halong - it was the only model I track on my site that consistently depicted a quick recurve south of Japan:
burgwx.bsky.social
Mistakes happen - my ECMWF ensemble data feed accidentally replaced the AIFS ensemble data last night. This has now been fixed & I backfilled all AIFS ensemble & deterministic plots back to 10/4.

ICYMI: AIFS ensemble TC tracks are now live on PolarWx: polarwx.com/tropical
Reposted by Tomer Burg
burgwx.bsky.social
Continuing down my tropical website checklist, AIFS ensemble tracks are now available on my website where storms can be identified & tracked in the model data.

Scroll over to the "Ensembles" tab for each storm to view AIFS ensemble maps if available:

polarwx.com/tropical/
burgwx.bsky.social
Continuing down my tropical website checklist, AIFS ensemble tracks are now available on my website where storms can be identified & tracked in the model data.

Scroll over to the "Ensembles" tab for each storm to view AIFS ensemble maps if available:

polarwx.com/tropical/
burgwx.bsky.social
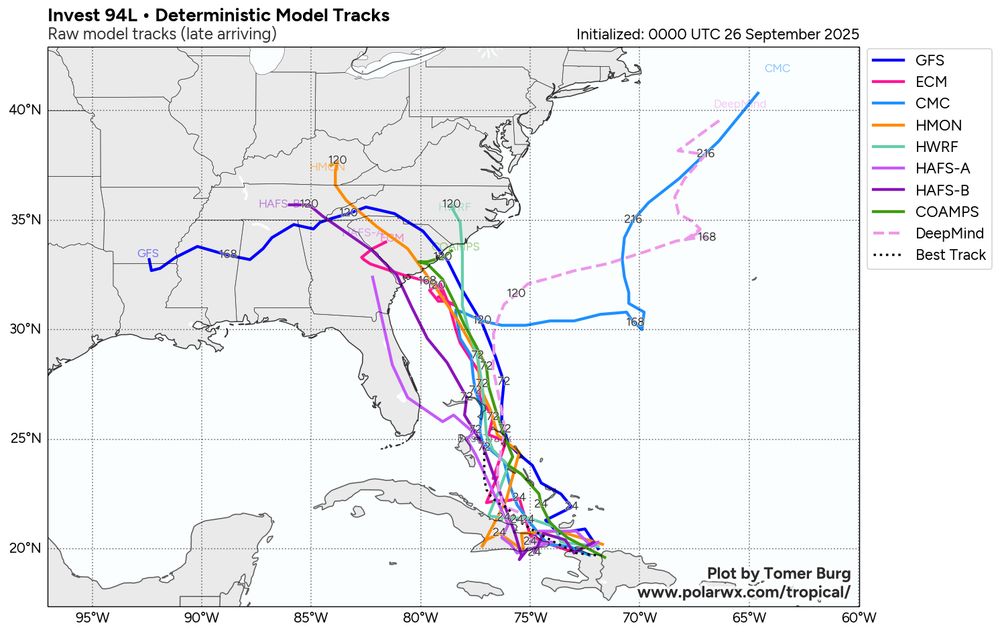
Invest 95L has been tagged by NHC this morning. Most ensemble members keep it away from the Caribbean Islands, but differ with its development rate with the GFS/GEFS suite still the most aggressive with its intensity.

View more data for 95L here:
polarwx.com/tropical/?st...
burgwx.bsky.social
The GEFS continue to be fairly aggressive with developing the next Atlantic wave into a long-track MDR hurricane. Conversely, the Google DeepMind FNV3 ensemble mostly keeps this system weak. Will be interesting to see how each suite verifies.
burgwx.bsky.social
Cyclone tracking problems 101:

At a glance this map seems to show large spread/uncertainty in forecast tracks for Humberto... but nope, it's just cyclone trackers struggling to differentiate between Humberto & Imelda as they merge into a single extratropical cyclone.
burgwx.bsky.social
An ensemble system that actually did perform consistently well for Imelda was the UKMET MOGREPS ensemble.

At no point did more than a handful of ensemble members show it approaching the Carolinas.
burgwx.bsky.social
This goes back to the “survivor bias” phenomenon I talked about a few days ago — most members show landfall while the ensemble mean stays offshore.

Meaning, the ensemble mean avoiding landfall wasn’t necessarily right for the correct reason.

bsky.app/profile/burg...
burgwx.bsky.social
IMPORTANT NOTE 🚨

When looking at ensemble means, beware of the "survivors bias". For example, the GEFS *mean* misses the coast... but most GEFS members make landfall!

This has to do with the storm timing. Consider how some members move the storm faster than others... (cont.)
burgwx.bsky.social
First, consider that Google DeepMind is actually an ensemble, and the line you see on the left image for DeepMind is the ensemble mean.

The right image shows the ensemble spread from that run… and most members actually showed landfall in the Carolinas that run:
burgwx.bsky.social
Adding my 2 cents to the discussion on Google DeepMind’s performance for Imelda… 🧵

You might see a map like this and be impressed that at no point did it predict landfall in the US. But there is a lot of context lost by simplifying it to just one image.
burgwx.bsky.social
Spectacular sunset in the Northeast associated with clouds well ahead of Tropical Storm Imelda; which, in suburban New Jersey means catching a glimpse in between houses, trees, and power lines
burgwx.bsky.social
I don’t produce the multi model ensemble plots for 6/18z cycles (since EPS only goes out to f144 & no CMC ens), but here’s the 0z cycle from that day:
burgwx.bsky.social
While it’s always good to be prepared in case the worst does happen, overplaying an uncertain forecast can risk playing into people’s fears, especially in the Carolinas on the 1-year anniversary of Helene. Too much of this & people will understandably trust meteorologists less.
burgwx.bsky.social
Unfortunately, striking a nuanced balance is not an approach that yields the most clicks nowadays.

Some people want definitive answers where there aren’t any yet. Some would rather highlight the worst case scenario, whether for legitimate concerns or engagement bait.
burgwx.bsky.social
That was the balance I tried to strike with my posts on Imelda — highlighting that despite the potential for a landfall & heavy rainfall, there was still much uncertainty re: whether landfall will happen & the forecast should be monitored further.
burgwx.bsky.social
This presents a real communication challenge — in hindsight there was no way to know with 100% certainty which scenario will happen.

So how do you convey the risks of a landfall (major flooding & wind/surge) while emphasizing its far from a guarantee, and it may miss instead?