Caspar Geenen
@caspargeenen.bsky.social
92 followers
130 following
13 posts
Working on a PhD at Clinical Microbiology Lab, KU Leuven. Investigating new ways to track the spread of infections. #IDEpi
Posts
Media
Videos
Starter Packs
Reposted by Caspar Geenen


Reposted by Caspar Geenen


Caspar Geenen
@caspargeenen.bsky.social
· Apr 28

Mauro Faccin
@maurofaccin.bsky.social
· Apr 28

Analyzing Satellite Imagery to Target Tuberculosis Control Interventions in Densely Urbanized Areas of Kigali, Rwanda: Cross-Sectional Pilot Study
Background: Early diagnosis and treatment initiation for tuberculosis (TB) not only improve individual patient outcomes, but also reduce circulation within communities. Active case-finding (ACF), a co...
publichealth.jmir.org
Reposted by Caspar Geenen


Reposted by Caspar Geenen

Ilan Schwartz
@germhuntermd.bsky.social
· Mar 24

Silence=Death Redux: Infectious Diseases, Public Health, and the Imperative to Resist
The second Trump administration has released a torrent of executive policies hostile to public health, science, and marginalized populations. We outline th
academic.oup.com


Reposted by Caspar Geenen

Rodrigo Henríquez
@docmundele.bsky.social
· Feb 10

Mapping of regions with low tuberculosis notification and estimation of diagnostic gaps in Cameroon, evidence from OpenStreetMap and WorldPop data
Scientific Reports - Mapping of regions with low tuberculosis notification and estimation of diagnostic gaps in Cameroon, evidence from OpenStreetMap and WorldPop data
www.nature.com
Caspar Geenen
@caspargeenen.bsky.social
· Jan 30

Centralised Air Sampling From a Ventilation System for the Surveillance of Respiratory Pathogens
Background: The COVID-19 pandemic has triggered a renewed interest in indoor air sampling for infectious disease surveillance. However, scalability is currently limited, as samples are usually collec...
onlinelibrary.wiley.com
Caspar Geenen
@caspargeenen.bsky.social
· Jan 30

Untargeted viral metagenomics of indoor air as a novel surveillance tool for respiratory, enteric and skin viruses
Conventional hospital-based infectious disease surveillance struggles to detect mild or asymptomatic infections and incurs high costs for large-scale testing during outbreaks. In contrast, environment...
www.medrxiv.org
Caspar Geenen
@caspargeenen.bsky.social
· Jan 30

Indoor air surveillance and factors associated with respiratory pathogen detection in community settings in Belgium - Nature Communications
Surveillance of respiratory pathogens in air may improve understanding of indoor transmission risks but impacts of context-specific factors on pathogen abundance are not well understood. Here, the aut...
www.nature.com
Caspar Geenen
@caspargeenen.bsky.social
· Jan 30

New questions and avenues for research regarding interpretation of the significance of respiratory viruses adrift in the air
Respiratory infections are the leading reason for hospitalisations worldwide.1 While
numerous human respiratory viruses have been identified, the manner by which they
are transmitted person-to-person ...
lancet.com
Caspar Geenen
@caspargeenen.bsky.social
· Jan 30

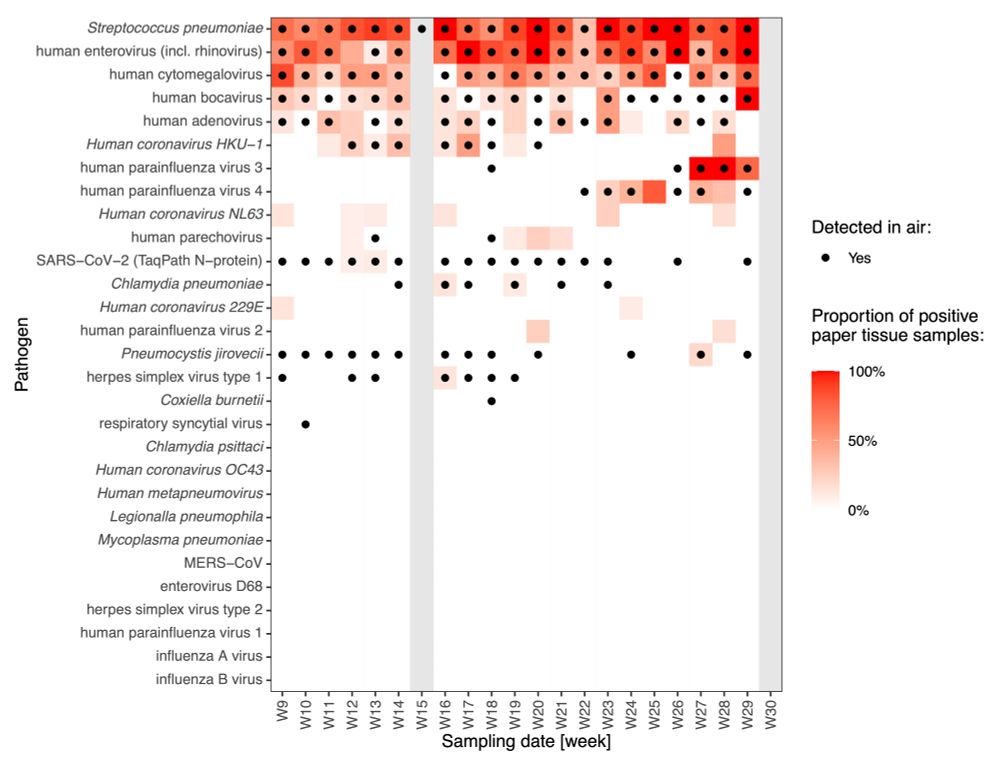
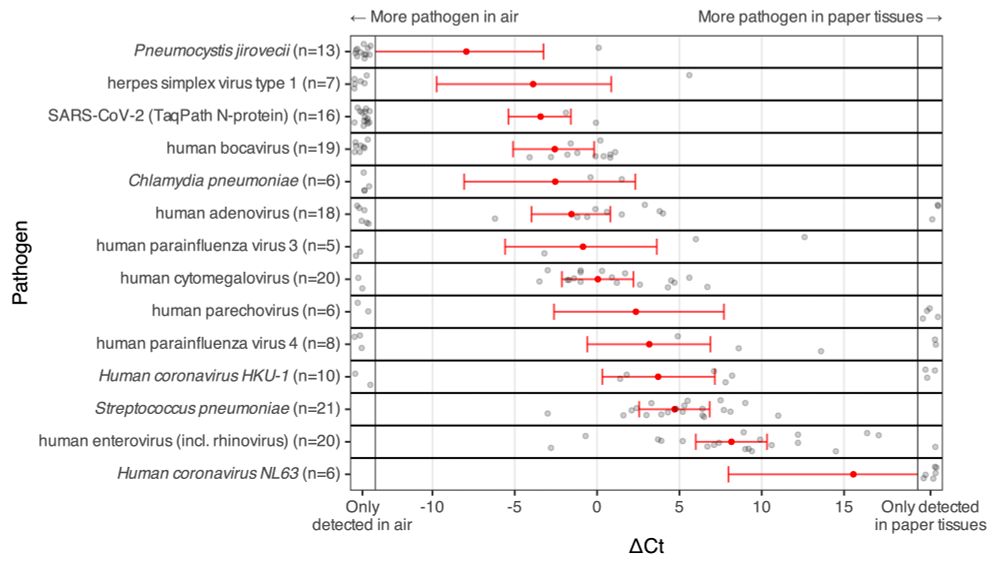
Interpretation of indoor air surveillance for respiratory infections: a prospective longitudinal observational study in a childcare setting
Our results suggest that air sampling could provide sensitive, responsive epidemiological
indicators for the surveillance of respiratory pathogens. Using air CO2 concentrations
to normalise such signa...
lancet.com
Reposted by Caspar Geenen
Reposted by Caspar Geenen


Caspar Geenen
@caspargeenen.bsky.social
· Dec 30

Risk factors for SARS-CoV-2 transmission in student residences: a case-ascertained study - Archives of Public Health
Background We aimed to investigate the overall secondary attack rates (SAR) of COVID-19 in student residences and to identify risk factors for higher transmission. Methods We retrospectively analysed ...
archpublichealth.biomedcentral.com
Caspar Geenen
@caspargeenen.bsky.social
· Dec 30

Individual level analysis of digital proximity tracing for COVID-19 in Belgium highlights major bottlenecks - Nature Communications
Digital proximity tracing apps were widely used during the COVID-19 pandemic but have not been thoroughly evaluated. Here, the authors use data from students in Leuven, Belgium and estimate that apps ...
www.nature.com
Caspar Geenen
@caspargeenen.bsky.social
· Dec 30

Empirical evidence on the efficiency of backward contact tracing in COVID-19 - Nature Communications
Backward contact tracing aims to identify individuals who were infected by the same person as infected an index case, and has been shown to be effective in modelling studies of SARS-COV-2. Here, the a...
www.nature.com