Carl Churchill
@cchurchili.bsky.social
2.2K followers 340 following 400 posts
Graphics Reporter with The Wall Street Journal on Lenni-Lenape land a cobra vai fumar https://churchillgeo.com/
Posts Media Videos Starter Packs
cchurchili.bsky.social
An #infographic of an Indigenous calendar cycle from #Colombia, I found today
cchurchili.bsky.social
"The French are pretty much still holding out"

describes many things tbf
cchurchili.bsky.social
This is also why, for a while, the French held out with their own alternative standards (as the article states)
cchurchili.bsky.social
So is colonialism to blame when QGIS craps itself? No....but also yes, in a extremely indirect but not entirely seperated way. History connects things like that
cchurchili.bsky.social
my go-to example of how colonialism / history can effect mundane tech problems. This convention of 180W/180E is directly linked to the cultural power of the British empire and its enforcing of scientific standards.
cchurchili.bsky.social
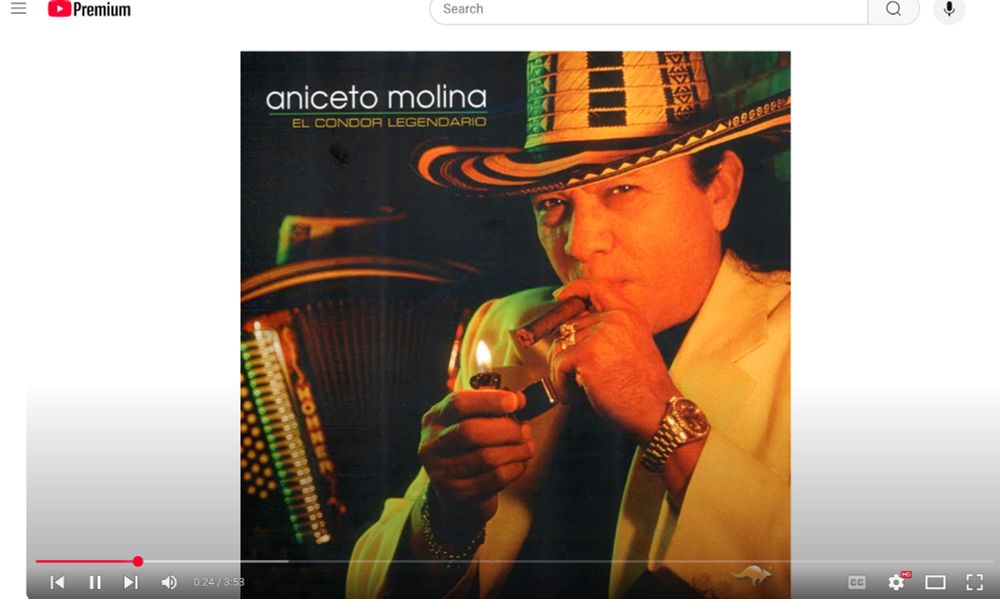
The mapping soundtrack atm
Reposted by Carl Churchill
rsimmon.bsky.social
I have a weird GDAL problem. I am trying to assign a spatial reference system to a JPEG world map and then reproject. Everything works if I use gdal_translate to make a GeoTIFF, but if I create a VRT as an intermediate step the corners of the reprojected image are filled. What gives?
Equal earth map reprojected from a GeoTIFF source file with areas off the map correctly filled with white (no data). (Original GeoTIFF is transparent.) Equal earth true color map reprojected from a VRT source file with areas off the map incorrectly filled with data from the other side of the international dateline.
cchurchili.bsky.social
Ive learned to expect consistently amazing (and harrowing) reporting from @shannonosaka.bsky.social
cchurchili.bsky.social
The accent on an 'i' will be the death of me
cchurchili.bsky.social
im just so jazzed about blender + satellite mosaics
cchurchili.bsky.social
To one and all a happy anniversary of the beginning of the world in the Maya long count calendar (give or take a day or 2).
cchurchili.bsky.social
Im proud to say I took this as someone who lives in new york and was totally useless and lost

(oh yeah I live in new york. Yk, new york *city*)
cchurchili.bsky.social
Great lakes through and through
Reposted by Carl Churchill
cchurchili.bsky.social
shoutout to whoever did USGS art in the 90s
cchurchili.bsky.social
you can do anything in blender yk
cchurchili.bsky.social
My favorite map here is Laris's
rsimmon.bsky.social
Four maps of the flooding in Kerr County, TX. Each newsroom drew on varied data sources & focused on a different aspect of the disaster.

Refined combination of color-coded rainfall data & shaded relief by Laris Karklis, @washingtonpost.com

wapo.st/3IpvrTu

#dataviz #cartography #ddj

1/4
Map of rainfall and topography for July 4 showing what led to the flooding in Kerr County, Texas. About 12 inches of rain fell on steep hillside that funneled into narrow stream valleys.
cchurchili.bsky.social
Nobody likes it when someone posts something cool and then is all coy about how they did it -

Volumes are tricky to deal with, but if you start with a texture coordinate, linked to the volume object, you can use its vector to get a image texture to work when hooked up to the volumes color.