Cédric Scherer
@cedricscherer.com
5.7K followers 690 following 340 posts
🧙‍♂️✨📊 Independent Data Visualization Designer, Consultant & Instructor | available for projects and workshops All things data & design with #rstats, #ggplot2, #Figma, #DataWrapper, #Flourish, and more Co-Founder of the #30DayChartChallenge
Posts Media Videos Starter Packs
Pinned
cedricscherer.com
Excited to launch "ggplot2 [un]charted" with @yan-holtz.bsky.social! 🎉

An online course to master #ggplot2 with exercises, quizzes, and modules—and hands-on code running in your browser!

Still WIP—sign up now for a limited discount:
👉 www.ggplot2-uncharted.com

#rstats #DataViz #DataVisualization
The landing page of the course "ggplot2 uncharted" with the title teasing it with "Master Data Visualizations with ggplot2".
cedricscherer.com
The inconsistency of spaces is bothering me much more 😅
cedricscherer.com
While they look great, be careful — several palettes are not colorblind-friendly or lack perceptual uniformity.
cedricscherer.com
Chart crimes are everywhere. I ate it.
A screenshot from the outro of a episode of "Welcome to Gravity Falls" with a swine pointing to a (badly designed) pie chart and the meme text "dis pie chart - i ated it"
Reposted by Cédric Scherer
alexselbyb.bsky.social
I have a slide about an unusual data request I once got: can we show that song choruses are appearing earlier due to the economics of streaming (gotta hook people in early to get paid)? I joked that it's not as if anyone's got a database of song structures. But it turns out that someone has...
An example of unusual data gathering - Compromise!

To listen to the weekly Top 40 from the past 20 years would take 96 days and nights
Just the No.1 singles would take 17 hours
Listening until the first chorus should only take 5 hours 
So we listened… and got our chart
Reposted by Cédric Scherer
dariia.bsky.social
❗️Our next workshop will be on August 14, 6 pm CEST, on marginaleffects package by
@vincentab.bsky.social !
Register or sponsor a student by donating to support Ukraine!
Details: bit.ly/3wBeY4S
Please share! #AcademicSky #EconSky #RStats
cedricscherer.com
Now also linked in the repository, together with a gallery image showcasing the featured examples and direct links to the codes.
cedricscherer.com
Slides are available, too - see my other comment :)
Reposted by Cédric Scherer
bearmathik.bsky.social
Did you know, that brown bears can make entire countries happier?

For statistical evidence of that fact, see the animation below
#rstats #ggplot #statistics #correlation #causation #Rprogramming #TidyTuesday #DataViz #RStudio

(this is of course meant to be humoristic)
🧵
cedricscherer.com
Thanks Sharon! (and the GitHub is now public, too)
Reposted by Cédric Scherer
smachlis.bsky.social
New presentation just posted at today's @user-conf.bsky.social virtual conference: Plot Twist: Adding Interactivity to the Elegance of ggplot2 with ggiraph

By @tanyashapiro.bsky.social & @cedricscherer.com

Video www.youtube.com/watch?v=GnDj...

#RStats #DataViz #ggplot2 #user2025
Plot Twist: Adding Interactivity to the Elegance of ggplot2 with ggiraph
YouTube video by useR! Conference
www.youtube.com
cedricscherer.com
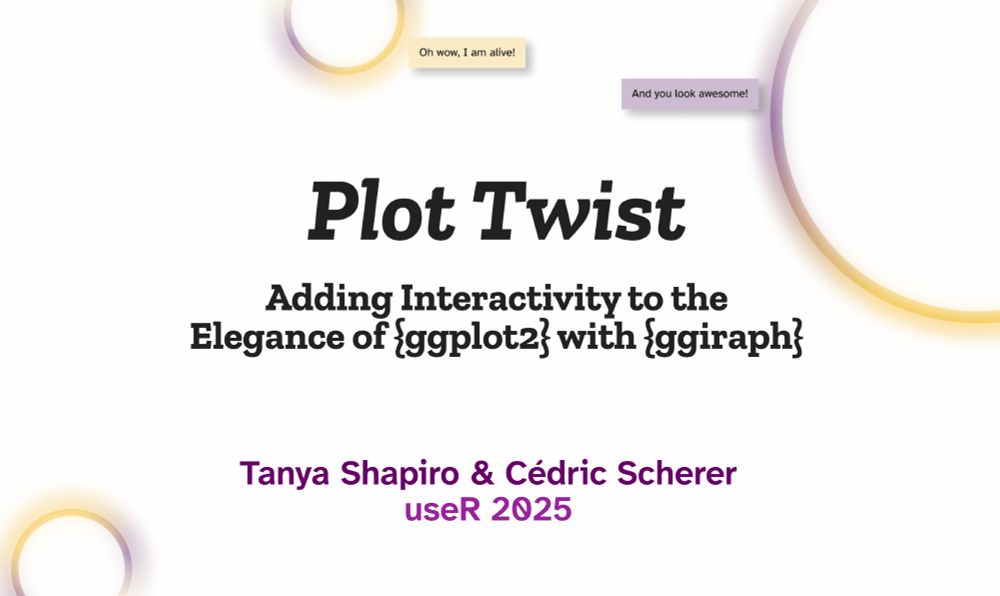
The virtual #user2025 event takes place today — and our talk "Plot Twist: Adding Interactivity to the Elegance of ggplot2 with ggiraph" airs is lined up next! 🎥

#rstats #ggiraph #ggplot2 #dataviz
Title slide for our talk at useR entitled "Plot Tiwst:Adding interactivity to the elegance of ggplot2 with ggiraph"
cedricscherer.com
Urgh...*searching for soemthing else.

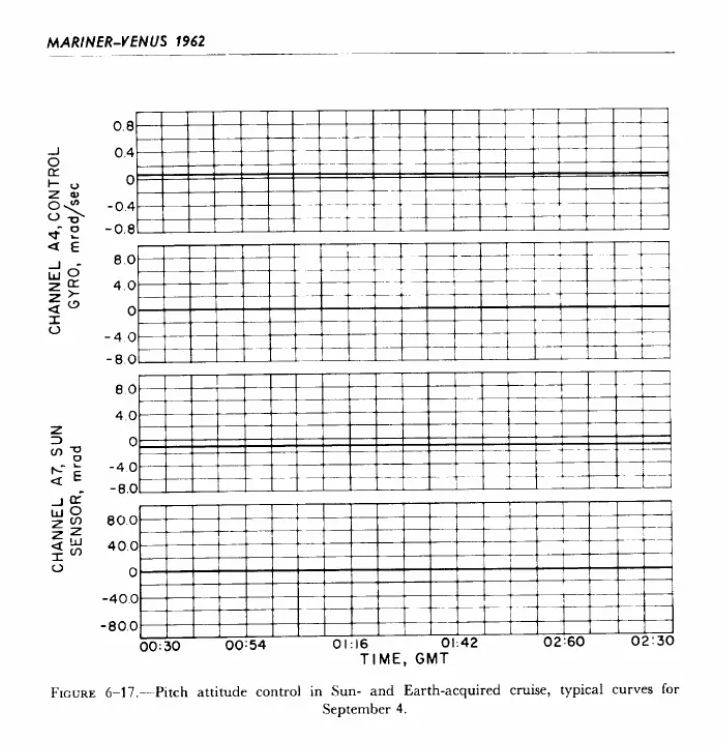
In any case the data is hard to spot in most all of these - and some lines are not straight (but most).
cedricscherer.com
I don't know what the purpose is as I haven't read the report (was searciigj for something else). I guess "show the results" and ss there are multiple graphs like this (with the same y axes), comparison *might* be more important for each of the panel across figures. Or it's more about "trends".
Reposted by Cédric Scherer
scotnational.bsky.social
Today's front page is a nod towards the US president's upcoming visit to Scotland 👀👇
The National's front page as Donald Trump set to arrive in Scotland
www.thenational.scot
cedricscherer.com
Find the data 🧐🤓
#dataviz #datatoinkratio
One of many line graphs in the NASA Mariner-Venus Report from 1962. Due to the rather black and bold and many grid lines, the straight lines  that show the results (which are also black) are almost invisible.
cedricscherer.com
Thank you Michael 👐
cedricscherer.com
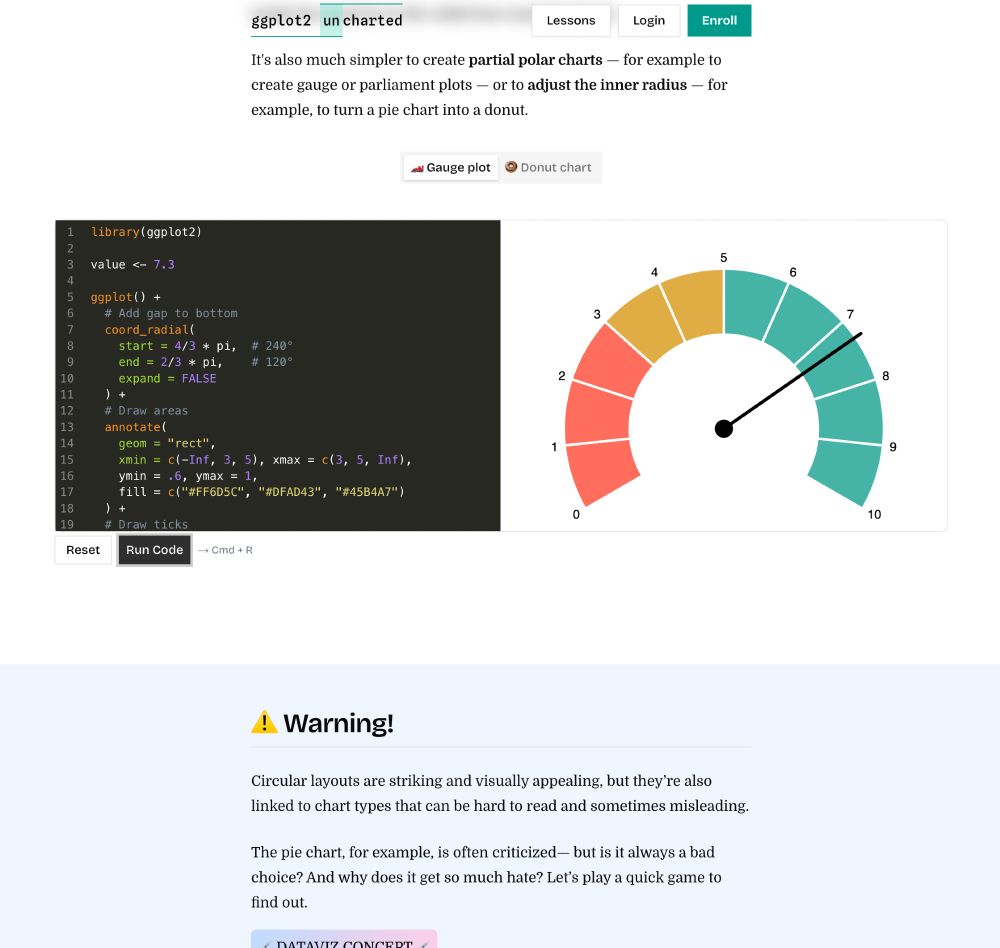
The version in our online "ggplot2 [un]charted" workshop to illustrate how to create partial radial plots with #ggplot2 — part of the lesson "Coordinate Systems: Setting the Stage for Your Plot"

www.ggplot2-uncharted.com/module1/coor...
Screenshot of the gauge chart, along with the code in our interactive in-browser sandbox in the coordinate lesson of our course "ggplot2 uncharted".
cedricscherer.com
Last week, I crafted my first-ever gauge chart 🏎️ to showcase partial radial plots for our #ggplot2 [un]charted lesson on "coordinate systems"

Thanks to coord_radial(), partial circles like those are super easy now — and of course I couldn’t resist making a polished and animated version 💅📽️ #rstats