


Census Dots
@censusdots.bsky.social
A map from https://censusdots.com/ shared daily
A dot map of Wichita Falls, TX's population by race, created using data from the 2020 US Census.
🔵 = White, 🟢 = Black, 🟠 = Hispanic, 🔴 = Asian, 🟤 = Native American/Other, 🟣 = Multiracial
Explore the map: https://www.censusdots.com/race/wichita-falls-tx-demographics?src=bluesky
🔵 = White, 🟢 = Black, 🟠 = Hispanic, 🔴 = Asian, 🟤 = Native American/Other, 🟣 = Multiracial
Explore the map: https://www.censusdots.com/race/wichita-falls-tx-demographics?src=bluesky

November 27, 2025 at 6:00 PM
A dot map of Wichita Falls, TX's population by race, created using data from the 2020 US Census.
🔵 = White, 🟢 = Black, 🟠 = Hispanic, 🔴 = Asian, 🟤 = Native American/Other, 🟣 = Multiracial
Explore the map: https://www.censusdots.com/race/wichita-falls-tx-demographics?src=bluesky
🔵 = White, 🟢 = Black, 🟠 = Hispanic, 🔴 = Asian, 🟤 = Native American/Other, 🟣 = Multiracial
Explore the map: https://www.censusdots.com/race/wichita-falls-tx-demographics?src=bluesky
A dot map of Westminster, CO's population by race, created using data from the 2020 US Census.
🔵 = White, 🟢 = Black, 🟠 = Hispanic, 🔴 = Asian, 🟤 = Native American/Other, 🟣 = Multiracial
Explore the map: https://www.censusdots.com/race/westminster-co-demographics?src=bluesky
🔵 = White, 🟢 = Black, 🟠 = Hispanic, 🔴 = Asian, 🟤 = Native American/Other, 🟣 = Multiracial
Explore the map: https://www.censusdots.com/race/westminster-co-demographics?src=bluesky

November 26, 2025 at 6:00 PM
A dot map of Westminster, CO's population by race, created using data from the 2020 US Census.
🔵 = White, 🟢 = Black, 🟠 = Hispanic, 🔴 = Asian, 🟤 = Native American/Other, 🟣 = Multiracial
Explore the map: https://www.censusdots.com/race/westminster-co-demographics?src=bluesky
🔵 = White, 🟢 = Black, 🟠 = Hispanic, 🔴 = Asian, 🟤 = Native American/Other, 🟣 = Multiracial
Explore the map: https://www.censusdots.com/race/westminster-co-demographics?src=bluesky
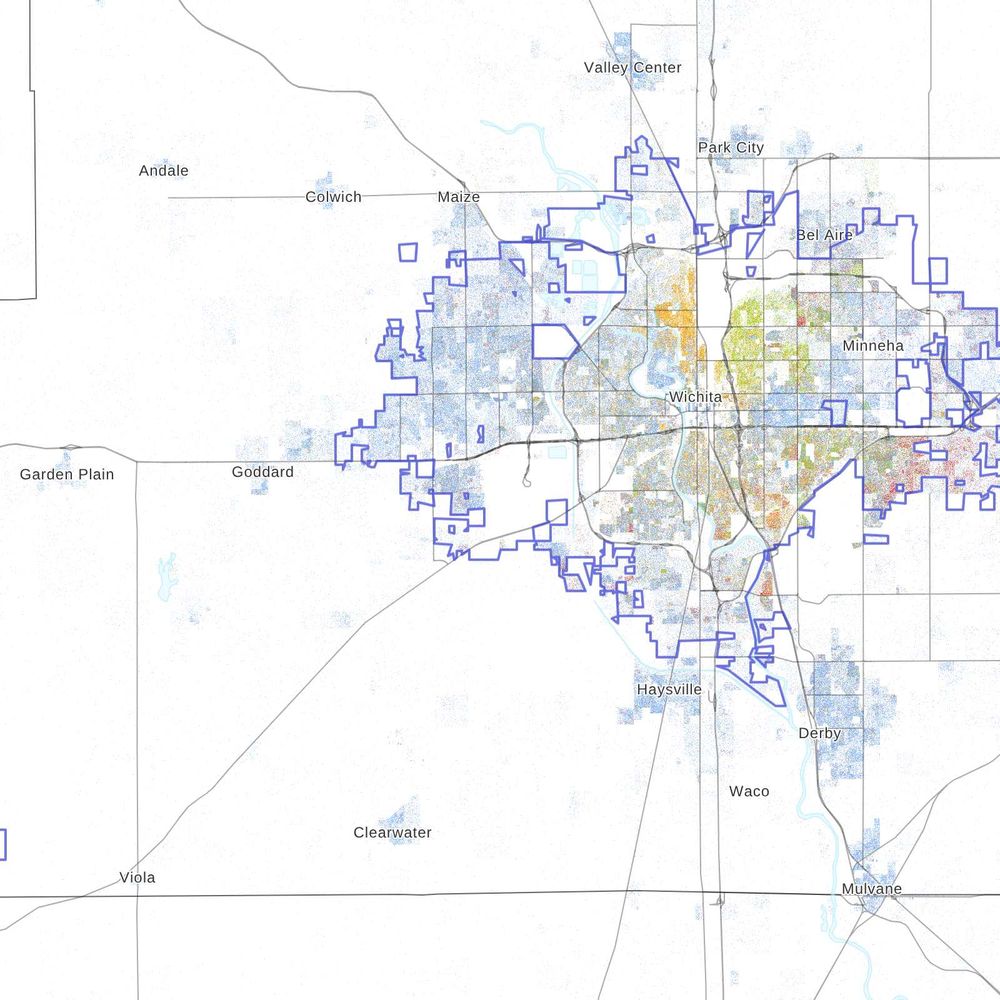
A dot map of Wichita, KS's population by race, created using data from the 2020 US Census.
🔵 = White, 🟢 = Black, 🟠 = Hispanic, 🔴 = Asian, 🟤 = Native American/Other, 🟣 = Multiracial
Explore the map: https://www.censusdots.com/race/wichita-ks-demographics?src=bluesky
🔵 = White, 🟢 = Black, 🟠 = Hispanic, 🔴 = Asian, 🟤 = Native American/Other, 🟣 = Multiracial
Explore the map: https://www.censusdots.com/race/wichita-ks-demographics?src=bluesky
November 25, 2025 at 6:00 PM
A dot map of Wichita, KS's population by race, created using data from the 2020 US Census.
🔵 = White, 🟢 = Black, 🟠 = Hispanic, 🔴 = Asian, 🟤 = Native American/Other, 🟣 = Multiracial
Explore the map: https://www.censusdots.com/race/wichita-ks-demographics?src=bluesky
🔵 = White, 🟢 = Black, 🟠 = Hispanic, 🔴 = Asian, 🟤 = Native American/Other, 🟣 = Multiracial
Explore the map: https://www.censusdots.com/race/wichita-ks-demographics?src=bluesky
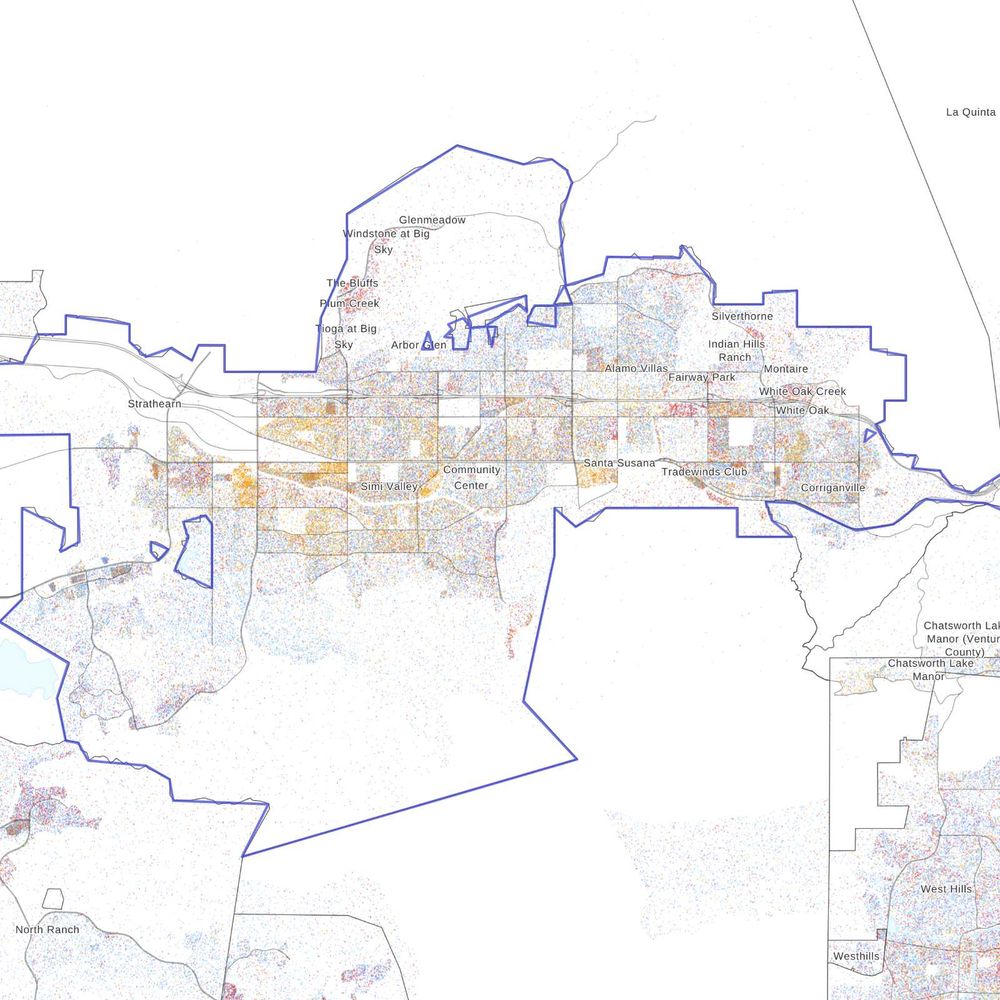
A dot map of Simi Valley, CA's population by race, created using data from the 2020 US Census.
🔵 = White, 🟢 = Black, 🟠 = Hispanic, 🔴 = Asian, 🟤 = Native American/Other, 🟣 = Multiracial
Explore the map: https://www.censusdots.com/race/simi-valley-ca-demographics?src=bluesky
🔵 = White, 🟢 = Black, 🟠 = Hispanic, 🔴 = Asian, 🟤 = Native American/Other, 🟣 = Multiracial
Explore the map: https://www.censusdots.com/race/simi-valley-ca-demographics?src=bluesky
November 24, 2025 at 6:00 PM
A dot map of Simi Valley, CA's population by race, created using data from the 2020 US Census.
🔵 = White, 🟢 = Black, 🟠 = Hispanic, 🔴 = Asian, 🟤 = Native American/Other, 🟣 = Multiracial
Explore the map: https://www.censusdots.com/race/simi-valley-ca-demographics?src=bluesky
🔵 = White, 🟢 = Black, 🟠 = Hispanic, 🔴 = Asian, 🟤 = Native American/Other, 🟣 = Multiracial
Explore the map: https://www.censusdots.com/race/simi-valley-ca-demographics?src=bluesky
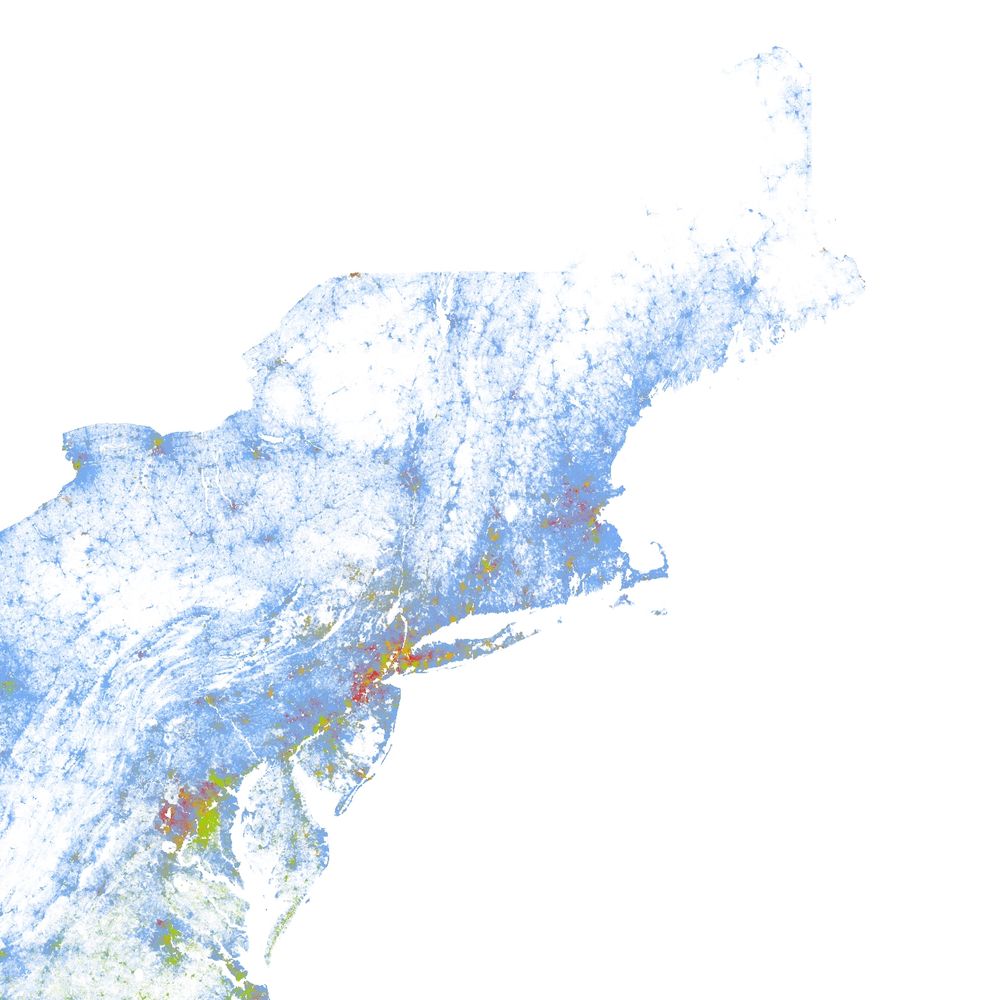
A dot map of Providence, RI's population by race, created using data from the 2020 US Census.
🔵 = White, 🟢 = Black, 🟠 = Hispanic, 🔴 = Asian, 🟤 = Native American/Other, 🟣 = Multiracial
Explore the map: https://www.censusdots.com/race/providence-ri-demographics?src=bluesky
🔵 = White, 🟢 = Black, 🟠 = Hispanic, 🔴 = Asian, 🟤 = Native American/Other, 🟣 = Multiracial
Explore the map: https://www.censusdots.com/race/providence-ri-demographics?src=bluesky

November 23, 2025 at 6:00 PM
A dot map of Providence, RI's population by race, created using data from the 2020 US Census.
🔵 = White, 🟢 = Black, 🟠 = Hispanic, 🔴 = Asian, 🟤 = Native American/Other, 🟣 = Multiracial
Explore the map: https://www.censusdots.com/race/providence-ri-demographics?src=bluesky
🔵 = White, 🟢 = Black, 🟠 = Hispanic, 🔴 = Asian, 🟤 = Native American/Other, 🟣 = Multiracial
Explore the map: https://www.censusdots.com/race/providence-ri-demographics?src=bluesky
A dot map of Rancho Cucamonga, CA's population by race, created using data from the 2020 US Census.
🔵 = White, 🟢 = Black, 🟠 = Hispanic, 🔴 = Asian, 🟤 = Native American/Other, 🟣 = Multiracial
Explore the map: https://www.censusdots.com/race/rancho-cucamonga-ca-demographics?src=bluesky
🔵 = White, 🟢 = Black, 🟠 = Hispanic, 🔴 = Asian, 🟤 = Native American/Other, 🟣 = Multiracial
Explore the map: https://www.censusdots.com/race/rancho-cucamonga-ca-demographics?src=bluesky

November 22, 2025 at 6:00 PM
A dot map of Rancho Cucamonga, CA's population by race, created using data from the 2020 US Census.
🔵 = White, 🟢 = Black, 🟠 = Hispanic, 🔴 = Asian, 🟤 = Native American/Other, 🟣 = Multiracial
Explore the map: https://www.censusdots.com/race/rancho-cucamonga-ca-demographics?src=bluesky
🔵 = White, 🟢 = Black, 🟠 = Hispanic, 🔴 = Asian, 🟤 = Native American/Other, 🟣 = Multiracial
Explore the map: https://www.censusdots.com/race/rancho-cucamonga-ca-demographics?src=bluesky
A dot map of Burbank, CA's population by race, created using data from the 2020 US Census.
🔵 = White, 🟢 = Black, 🟠 = Hispanic, 🔴 = Asian, 🟤 = Native American/Other, 🟣 = Multiracial
Explore the map: https://www.censusdots.com/race/burbank-ca-demographics?src=bluesky
🔵 = White, 🟢 = Black, 🟠 = Hispanic, 🔴 = Asian, 🟤 = Native American/Other, 🟣 = Multiracial
Explore the map: https://www.censusdots.com/race/burbank-ca-demographics?src=bluesky
November 21, 2025 at 6:00 PM
A dot map of Burbank, CA's population by race, created using data from the 2020 US Census.
🔵 = White, 🟢 = Black, 🟠 = Hispanic, 🔴 = Asian, 🟤 = Native American/Other, 🟣 = Multiracial
Explore the map: https://www.censusdots.com/race/burbank-ca-demographics?src=bluesky
🔵 = White, 🟢 = Black, 🟠 = Hispanic, 🔴 = Asian, 🟤 = Native American/Other, 🟣 = Multiracial
Explore the map: https://www.censusdots.com/race/burbank-ca-demographics?src=bluesky
A dot map of Bellevue, WA's population by race, created using data from the 2020 US Census.
🔵 = White, 🟢 = Black, 🟠 = Hispanic, 🔴 = Asian, 🟤 = Native American/Other, 🟣 = Multiracial
Explore the map: https://www.censusdots.com/race/bellevue-wa-demographics?src=bluesky
🔵 = White, 🟢 = Black, 🟠 = Hispanic, 🔴 = Asian, 🟤 = Native American/Other, 🟣 = Multiracial
Explore the map: https://www.censusdots.com/race/bellevue-wa-demographics?src=bluesky

November 20, 2025 at 6:00 PM
A dot map of Bellevue, WA's population by race, created using data from the 2020 US Census.
🔵 = White, 🟢 = Black, 🟠 = Hispanic, 🔴 = Asian, 🟤 = Native American/Other, 🟣 = Multiracial
Explore the map: https://www.censusdots.com/race/bellevue-wa-demographics?src=bluesky
🔵 = White, 🟢 = Black, 🟠 = Hispanic, 🔴 = Asian, 🟤 = Native American/Other, 🟣 = Multiracial
Explore the map: https://www.censusdots.com/race/bellevue-wa-demographics?src=bluesky
A dot map of Sugar Land, TX's population by race, created using data from the 2020 US Census.
🔵 = White, 🟢 = Black, 🟠 = Hispanic, 🔴 = Asian, 🟤 = Native American/Other, 🟣 = Multiracial
Explore the map: https://www.censusdots.com/race/sugar-land-tx-demographics?src=bluesky
🔵 = White, 🟢 = Black, 🟠 = Hispanic, 🔴 = Asian, 🟤 = Native American/Other, 🟣 = Multiracial
Explore the map: https://www.censusdots.com/race/sugar-land-tx-demographics?src=bluesky

November 19, 2025 at 6:01 PM
A dot map of Sugar Land, TX's population by race, created using data from the 2020 US Census.
🔵 = White, 🟢 = Black, 🟠 = Hispanic, 🔴 = Asian, 🟤 = Native American/Other, 🟣 = Multiracial
Explore the map: https://www.censusdots.com/race/sugar-land-tx-demographics?src=bluesky
🔵 = White, 🟢 = Black, 🟠 = Hispanic, 🔴 = Asian, 🟤 = Native American/Other, 🟣 = Multiracial
Explore the map: https://www.censusdots.com/race/sugar-land-tx-demographics?src=bluesky
A dot map of Richardson, TX's population by race, created using data from the 2020 US Census.
🔵 = White, 🟢 = Black, 🟠 = Hispanic, 🔴 = Asian, 🟤 = Native American/Other, 🟣 = Multiracial
Explore the map: https://www.censusdots.com/race/richardson-tx-demographics?src=bluesky
🔵 = White, 🟢 = Black, 🟠 = Hispanic, 🔴 = Asian, 🟤 = Native American/Other, 🟣 = Multiracial
Explore the map: https://www.censusdots.com/race/richardson-tx-demographics?src=bluesky

November 18, 2025 at 6:00 PM
A dot map of Richardson, TX's population by race, created using data from the 2020 US Census.
🔵 = White, 🟢 = Black, 🟠 = Hispanic, 🔴 = Asian, 🟤 = Native American/Other, 🟣 = Multiracial
Explore the map: https://www.censusdots.com/race/richardson-tx-demographics?src=bluesky
🔵 = White, 🟢 = Black, 🟠 = Hispanic, 🔴 = Asian, 🟤 = Native American/Other, 🟣 = Multiracial
Explore the map: https://www.censusdots.com/race/richardson-tx-demographics?src=bluesky
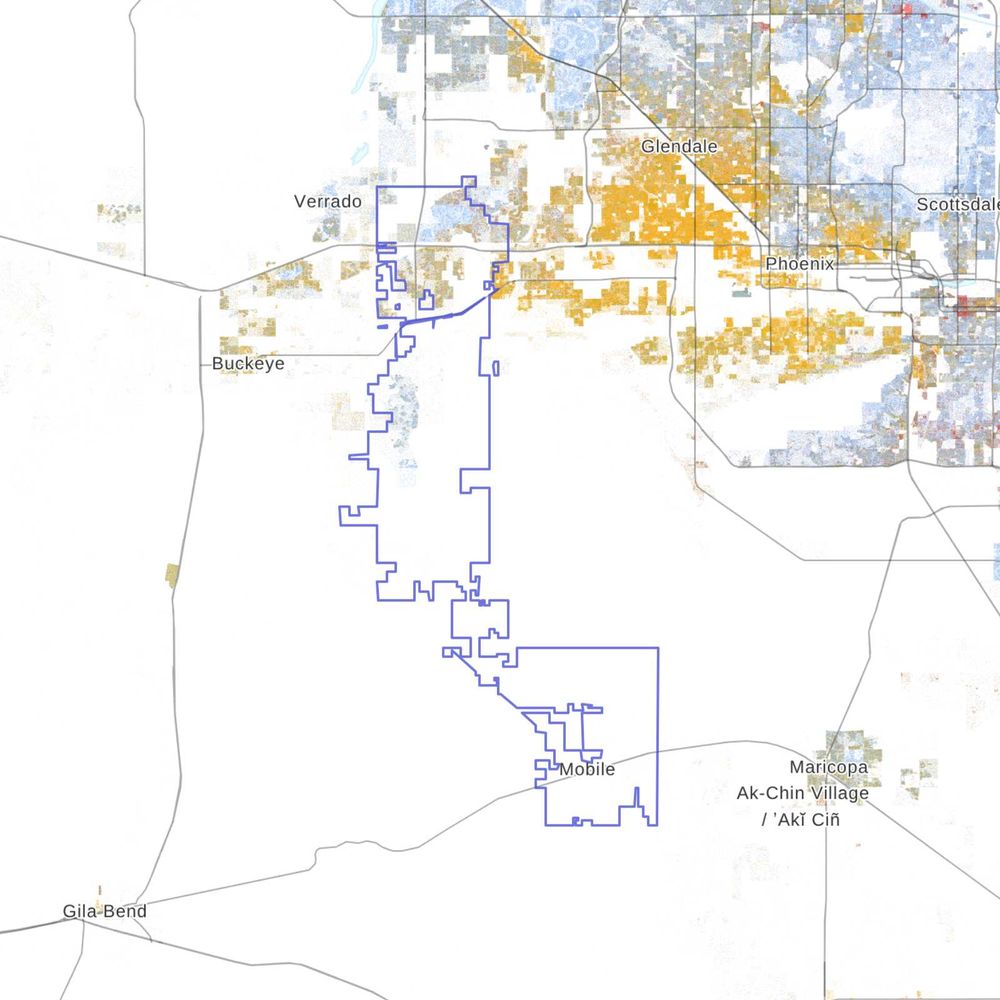
A dot map of Goodyear, AZ's population by race, created using data from the 2020 US Census.
🔵 = White, 🟢 = Black, 🟠 = Hispanic, 🔴 = Asian, 🟤 = Native American/Other, 🟣 = Multiracial
Explore the map: https://www.censusdots.com/race/goodyear-az-demographics?src=bluesky
🔵 = White, 🟢 = Black, 🟠 = Hispanic, 🔴 = Asian, 🟤 = Native American/Other, 🟣 = Multiracial
Explore the map: https://www.censusdots.com/race/goodyear-az-demographics?src=bluesky
November 17, 2025 at 6:00 PM
A dot map of Goodyear, AZ's population by race, created using data from the 2020 US Census.
🔵 = White, 🟢 = Black, 🟠 = Hispanic, 🔴 = Asian, 🟤 = Native American/Other, 🟣 = Multiracial
Explore the map: https://www.censusdots.com/race/goodyear-az-demographics?src=bluesky
🔵 = White, 🟢 = Black, 🟠 = Hispanic, 🔴 = Asian, 🟤 = Native American/Other, 🟣 = Multiracial
Explore the map: https://www.censusdots.com/race/goodyear-az-demographics?src=bluesky
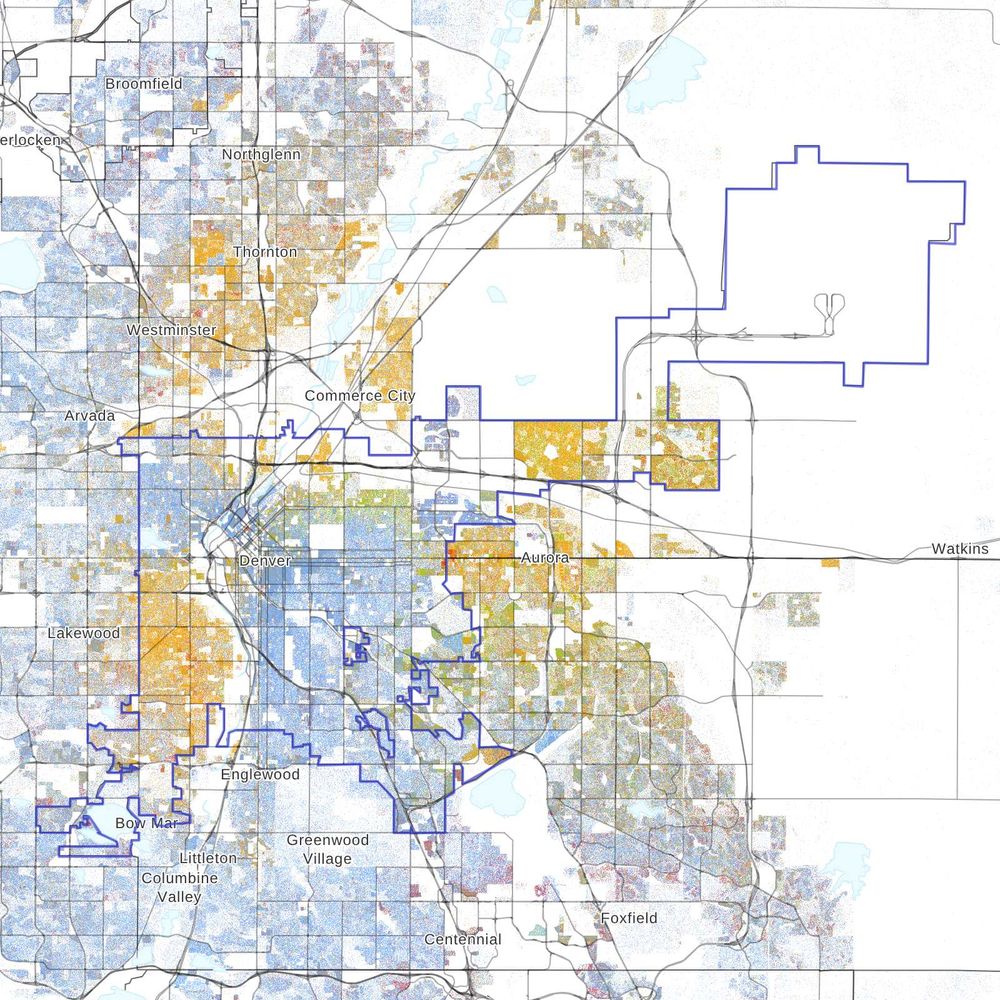
A dot map of Denver, CO's population by race, created using data from the 2020 US Census.
🔵 = White, 🟢 = Black, 🟠 = Hispanic, 🔴 = Asian, 🟤 = Native American/Other, 🟣 = Multiracial
Explore the map: https://www.censusdots.com/race/denver-co-demographics?src=bluesky
🔵 = White, 🟢 = Black, 🟠 = Hispanic, 🔴 = Asian, 🟤 = Native American/Other, 🟣 = Multiracial
Explore the map: https://www.censusdots.com/race/denver-co-demographics?src=bluesky
November 16, 2025 at 6:00 PM
A dot map of Denver, CO's population by race, created using data from the 2020 US Census.
🔵 = White, 🟢 = Black, 🟠 = Hispanic, 🔴 = Asian, 🟤 = Native American/Other, 🟣 = Multiracial
Explore the map: https://www.censusdots.com/race/denver-co-demographics?src=bluesky
🔵 = White, 🟢 = Black, 🟠 = Hispanic, 🔴 = Asian, 🟤 = Native American/Other, 🟣 = Multiracial
Explore the map: https://www.censusdots.com/race/denver-co-demographics?src=bluesky
A dot map of Tracy, CA's population by race, created using data from the 2020 US Census.
🔵 = White, 🟢 = Black, 🟠 = Hispanic, 🔴 = Asian, 🟤 = Native American/Other, 🟣 = Multiracial
Explore the map: https://www.censusdots.com/race/tracy-ca-demographics?src=bluesky
🔵 = White, 🟢 = Black, 🟠 = Hispanic, 🔴 = Asian, 🟤 = Native American/Other, 🟣 = Multiracial
Explore the map: https://www.censusdots.com/race/tracy-ca-demographics?src=bluesky

November 15, 2025 at 6:00 PM
A dot map of Tracy, CA's population by race, created using data from the 2020 US Census.
🔵 = White, 🟢 = Black, 🟠 = Hispanic, 🔴 = Asian, 🟤 = Native American/Other, 🟣 = Multiracial
Explore the map: https://www.censusdots.com/race/tracy-ca-demographics?src=bluesky
🔵 = White, 🟢 = Black, 🟠 = Hispanic, 🔴 = Asian, 🟤 = Native American/Other, 🟣 = Multiracial
Explore the map: https://www.censusdots.com/race/tracy-ca-demographics?src=bluesky
A dot map of Newark, NJ's population by race, created using data from the 2020 US Census.
🔵 = White, 🟢 = Black, 🟠 = Hispanic, 🔴 = Asian, 🟤 = Native American/Other, 🟣 = Multiracial
Explore the map: https://www.censusdots.com/race/newark-nj-demographics?src=bluesky
🔵 = White, 🟢 = Black, 🟠 = Hispanic, 🔴 = Asian, 🟤 = Native American/Other, 🟣 = Multiracial
Explore the map: https://www.censusdots.com/race/newark-nj-demographics?src=bluesky

November 14, 2025 at 6:00 PM
A dot map of Newark, NJ's population by race, created using data from the 2020 US Census.
🔵 = White, 🟢 = Black, 🟠 = Hispanic, 🔴 = Asian, 🟤 = Native American/Other, 🟣 = Multiracial
Explore the map: https://www.censusdots.com/race/newark-nj-demographics?src=bluesky
🔵 = White, 🟢 = Black, 🟠 = Hispanic, 🔴 = Asian, 🟤 = Native American/Other, 🟣 = Multiracial
Explore the map: https://www.censusdots.com/race/newark-nj-demographics?src=bluesky
A dot map of Peoria, IL's population by race, created using data from the 2020 US Census.
🔵 = White, 🟢 = Black, 🟠 = Hispanic, 🔴 = Asian, 🟤 = Native American/Other, 🟣 = Multiracial
Explore the map: https://www.censusdots.com/race/peoria-il-demographics?src=bluesky
🔵 = White, 🟢 = Black, 🟠 = Hispanic, 🔴 = Asian, 🟤 = Native American/Other, 🟣 = Multiracial
Explore the map: https://www.censusdots.com/race/peoria-il-demographics?src=bluesky

November 13, 2025 at 6:00 PM
A dot map of Peoria, IL's population by race, created using data from the 2020 US Census.
🔵 = White, 🟢 = Black, 🟠 = Hispanic, 🔴 = Asian, 🟤 = Native American/Other, 🟣 = Multiracial
Explore the map: https://www.censusdots.com/race/peoria-il-demographics?src=bluesky
🔵 = White, 🟢 = Black, 🟠 = Hispanic, 🔴 = Asian, 🟤 = Native American/Other, 🟣 = Multiracial
Explore the map: https://www.censusdots.com/race/peoria-il-demographics?src=bluesky
A dot map of Orlando, FL's population by race, created using data from the 2020 US Census.
🔵 = White, 🟢 = Black, 🟠 = Hispanic, 🔴 = Asian, 🟤 = Native American/Other, 🟣 = Multiracial
Explore the map: https://www.censusdots.com/race/orlando-fl-demographics?src=bluesky
🔵 = White, 🟢 = Black, 🟠 = Hispanic, 🔴 = Asian, 🟤 = Native American/Other, 🟣 = Multiracial
Explore the map: https://www.censusdots.com/race/orlando-fl-demographics?src=bluesky

November 12, 2025 at 6:00 PM
A dot map of Orlando, FL's population by race, created using data from the 2020 US Census.
🔵 = White, 🟢 = Black, 🟠 = Hispanic, 🔴 = Asian, 🟤 = Native American/Other, 🟣 = Multiracial
Explore the map: https://www.censusdots.com/race/orlando-fl-demographics?src=bluesky
🔵 = White, 🟢 = Black, 🟠 = Hispanic, 🔴 = Asian, 🟤 = Native American/Other, 🟣 = Multiracial
Explore the map: https://www.censusdots.com/race/orlando-fl-demographics?src=bluesky
A dot map of Vancouver, WA's population by race, created using data from the 2020 US Census.
🔵 = White, 🟢 = Black, 🟠 = Hispanic, 🔴 = Asian, 🟤 = Native American/Other, 🟣 = Multiracial
Explore the map: https://www.censusdots.com/race/vancouver-wa-demographics?src=bluesky
🔵 = White, 🟢 = Black, 🟠 = Hispanic, 🔴 = Asian, 🟤 = Native American/Other, 🟣 = Multiracial
Explore the map: https://www.censusdots.com/race/vancouver-wa-demographics?src=bluesky

November 11, 2025 at 6:00 PM
A dot map of Vancouver, WA's population by race, created using data from the 2020 US Census.
🔵 = White, 🟢 = Black, 🟠 = Hispanic, 🔴 = Asian, 🟤 = Native American/Other, 🟣 = Multiracial
Explore the map: https://www.censusdots.com/race/vancouver-wa-demographics?src=bluesky
🔵 = White, 🟢 = Black, 🟠 = Hispanic, 🔴 = Asian, 🟤 = Native American/Other, 🟣 = Multiracial
Explore the map: https://www.censusdots.com/race/vancouver-wa-demographics?src=bluesky
A dot map of Macon, GA's population by race, created using data from the 2020 US Census.
🔵 = White, 🟢 = Black, 🟠 = Hispanic, 🔴 = Asian, 🟤 = Native American/Other, 🟣 = Multiracial
Explore the map: https://www.censusdots.com/race/macon-ga-demographics?src=bluesky
🔵 = White, 🟢 = Black, 🟠 = Hispanic, 🔴 = Asian, 🟤 = Native American/Other, 🟣 = Multiracial
Explore the map: https://www.censusdots.com/race/macon-ga-demographics?src=bluesky

November 10, 2025 at 6:00 PM
A dot map of Macon, GA's population by race, created using data from the 2020 US Census.
🔵 = White, 🟢 = Black, 🟠 = Hispanic, 🔴 = Asian, 🟤 = Native American/Other, 🟣 = Multiracial
Explore the map: https://www.censusdots.com/race/macon-ga-demographics?src=bluesky
🔵 = White, 🟢 = Black, 🟠 = Hispanic, 🔴 = Asian, 🟤 = Native American/Other, 🟣 = Multiracial
Explore the map: https://www.censusdots.com/race/macon-ga-demographics?src=bluesky
A dot map of St. Paul, MN's population by race, created using data from the 2020 US Census.
🔵 = White, 🟢 = Black, 🟠 = Hispanic, 🔴 = Asian, 🟤 = Native American/Other, 🟣 = Multiracial
Explore the map: https://www.censusdots.com/race/st-paul-mn-demographics?src=bluesky
🔵 = White, 🟢 = Black, 🟠 = Hispanic, 🔴 = Asian, 🟤 = Native American/Other, 🟣 = Multiracial
Explore the map: https://www.censusdots.com/race/st-paul-mn-demographics?src=bluesky

November 9, 2025 at 6:00 PM
A dot map of St. Paul, MN's population by race, created using data from the 2020 US Census.
🔵 = White, 🟢 = Black, 🟠 = Hispanic, 🔴 = Asian, 🟤 = Native American/Other, 🟣 = Multiracial
Explore the map: https://www.censusdots.com/race/st-paul-mn-demographics?src=bluesky
🔵 = White, 🟢 = Black, 🟠 = Hispanic, 🔴 = Asian, 🟤 = Native American/Other, 🟣 = Multiracial
Explore the map: https://www.censusdots.com/race/st-paul-mn-demographics?src=bluesky
A dot map of Santa Ana, CA's population by race, created using data from the 2020 US Census.
🔵 = White, 🟢 = Black, 🟠 = Hispanic, 🔴 = Asian, 🟤 = Native American/Other, 🟣 = Multiracial
Explore the map: https://www.censusdots.com/race/santa-ana-ca-demographics?src=bluesky
🔵 = White, 🟢 = Black, 🟠 = Hispanic, 🔴 = Asian, 🟤 = Native American/Other, 🟣 = Multiracial
Explore the map: https://www.censusdots.com/race/santa-ana-ca-demographics?src=bluesky

November 8, 2025 at 6:00 PM
A dot map of Santa Ana, CA's population by race, created using data from the 2020 US Census.
🔵 = White, 🟢 = Black, 🟠 = Hispanic, 🔴 = Asian, 🟤 = Native American/Other, 🟣 = Multiracial
Explore the map: https://www.censusdots.com/race/santa-ana-ca-demographics?src=bluesky
🔵 = White, 🟢 = Black, 🟠 = Hispanic, 🔴 = Asian, 🟤 = Native American/Other, 🟣 = Multiracial
Explore the map: https://www.censusdots.com/race/santa-ana-ca-demographics?src=bluesky
A dot map of Green Bay, WI's population by race, created using data from the 2020 US Census.
🔵 = White, 🟢 = Black, 🟠 = Hispanic, 🔴 = Asian, 🟤 = Native American/Other, 🟣 = Multiracial
Explore the map: https://www.censusdots.com/race/green-bay-wi-demographics?src=bluesky
🔵 = White, 🟢 = Black, 🟠 = Hispanic, 🔴 = Asian, 🟤 = Native American/Other, 🟣 = Multiracial
Explore the map: https://www.censusdots.com/race/green-bay-wi-demographics?src=bluesky

November 7, 2025 at 6:00 PM
A dot map of Green Bay, WI's population by race, created using data from the 2020 US Census.
🔵 = White, 🟢 = Black, 🟠 = Hispanic, 🔴 = Asian, 🟤 = Native American/Other, 🟣 = Multiracial
Explore the map: https://www.censusdots.com/race/green-bay-wi-demographics?src=bluesky
🔵 = White, 🟢 = Black, 🟠 = Hispanic, 🔴 = Asian, 🟤 = Native American/Other, 🟣 = Multiracial
Explore the map: https://www.censusdots.com/race/green-bay-wi-demographics?src=bluesky
A dot map of West Covina, CA's population by race, created using data from the 2020 US Census.
🔵 = White, 🟢 = Black, 🟠 = Hispanic, 🔴 = Asian, 🟤 = Native American/Other, 🟣 = Multiracial
Explore the map: https://www.censusdots.com/race/west-covina-ca-demographics?src=bluesky
🔵 = White, 🟢 = Black, 🟠 = Hispanic, 🔴 = Asian, 🟤 = Native American/Other, 🟣 = Multiracial
Explore the map: https://www.censusdots.com/race/west-covina-ca-demographics?src=bluesky

November 6, 2025 at 6:00 PM
A dot map of West Covina, CA's population by race, created using data from the 2020 US Census.
🔵 = White, 🟢 = Black, 🟠 = Hispanic, 🔴 = Asian, 🟤 = Native American/Other, 🟣 = Multiracial
Explore the map: https://www.censusdots.com/race/west-covina-ca-demographics?src=bluesky
🔵 = White, 🟢 = Black, 🟠 = Hispanic, 🔴 = Asian, 🟤 = Native American/Other, 🟣 = Multiracial
Explore the map: https://www.censusdots.com/race/west-covina-ca-demographics?src=bluesky
A dot map of Mesa, AZ's population by race, created using data from the 2020 US Census.
🔵 = White, 🟢 = Black, 🟠 = Hispanic, 🔴 = Asian, 🟤 = Native American/Other, 🟣 = Multiracial
Explore the map: https://www.censusdots.com/race/mesa-az-demographics?src=bluesky
🔵 = White, 🟢 = Black, 🟠 = Hispanic, 🔴 = Asian, 🟤 = Native American/Other, 🟣 = Multiracial
Explore the map: https://www.censusdots.com/race/mesa-az-demographics?src=bluesky

November 5, 2025 at 6:00 PM
A dot map of Mesa, AZ's population by race, created using data from the 2020 US Census.
🔵 = White, 🟢 = Black, 🟠 = Hispanic, 🔴 = Asian, 🟤 = Native American/Other, 🟣 = Multiracial
Explore the map: https://www.censusdots.com/race/mesa-az-demographics?src=bluesky
🔵 = White, 🟢 = Black, 🟠 = Hispanic, 🔴 = Asian, 🟤 = Native American/Other, 🟣 = Multiracial
Explore the map: https://www.censusdots.com/race/mesa-az-demographics?src=bluesky
A dot map of Mesquite, TX's population by race, created using data from the 2020 US Census.
🔵 = White, 🟢 = Black, 🟠 = Hispanic, 🔴 = Asian, 🟤 = Native American/Other, 🟣 = Multiracial
Explore the map: https://www.censusdots.com/race/mesquite-tx-demographics?src=bluesky
🔵 = White, 🟢 = Black, 🟠 = Hispanic, 🔴 = Asian, 🟤 = Native American/Other, 🟣 = Multiracial
Explore the map: https://www.censusdots.com/race/mesquite-tx-demographics?src=bluesky

November 4, 2025 at 6:01 PM
A dot map of Mesquite, TX's population by race, created using data from the 2020 US Census.
🔵 = White, 🟢 = Black, 🟠 = Hispanic, 🔴 = Asian, 🟤 = Native American/Other, 🟣 = Multiracial
Explore the map: https://www.censusdots.com/race/mesquite-tx-demographics?src=bluesky
🔵 = White, 🟢 = Black, 🟠 = Hispanic, 🔴 = Asian, 🟤 = Native American/Other, 🟣 = Multiracial
Explore the map: https://www.censusdots.com/race/mesquite-tx-demographics?src=bluesky
A dot map of Brockton, MA's population by race, created using data from the 2020 US Census.
🔵 = White, 🟢 = Black, 🟠 = Hispanic, 🔴 = Asian, 🟤 = Native American/Other, 🟣 = Multiracial
Explore the map: https://www.censusdots.com/race/brockton-ma-demographics?src=bluesky
🔵 = White, 🟢 = Black, 🟠 = Hispanic, 🔴 = Asian, 🟤 = Native American/Other, 🟣 = Multiracial
Explore the map: https://www.censusdots.com/race/brockton-ma-demographics?src=bluesky

November 3, 2025 at 6:01 PM
A dot map of Brockton, MA's population by race, created using data from the 2020 US Census.
🔵 = White, 🟢 = Black, 🟠 = Hispanic, 🔴 = Asian, 🟤 = Native American/Other, 🟣 = Multiracial
Explore the map: https://www.censusdots.com/race/brockton-ma-demographics?src=bluesky
🔵 = White, 🟢 = Black, 🟠 = Hispanic, 🔴 = Asian, 🟤 = Native American/Other, 🟣 = Multiracial
Explore the map: https://www.censusdots.com/race/brockton-ma-demographics?src=bluesky