CharityDataversiveXR
@charitylovesxr.bsky.social
210 followers 540 following 41 posts
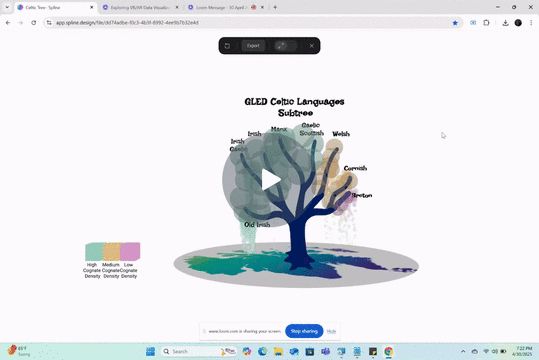
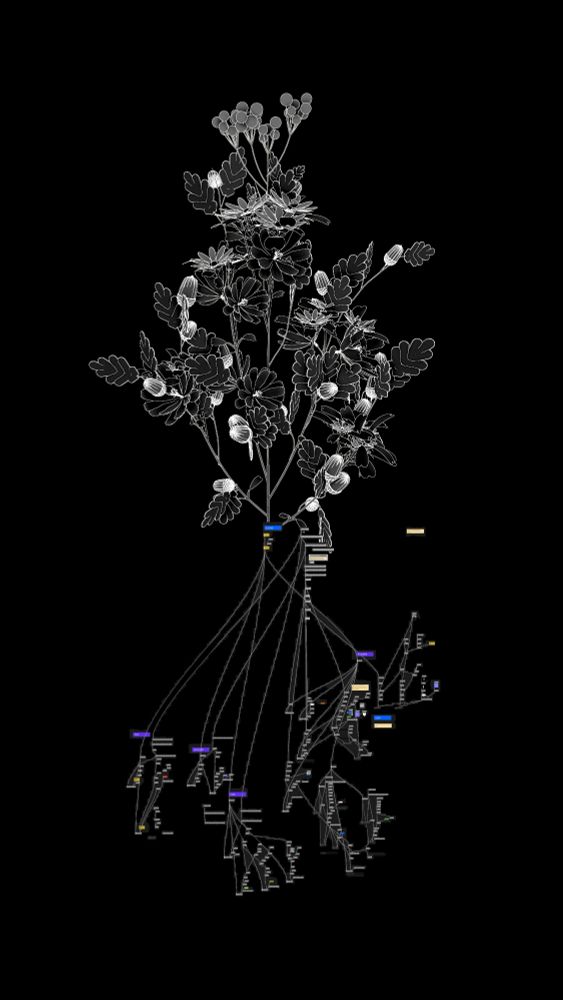
WebXR base Data Journalist posting about the fusion of immersive tech and data storytelling. Check out my portfolio: https://github.com/CharityEverett/charity-everett.github.io .
Posts Media Videos Starter Packs
Pinned
charitylovesxr.bsky.social
Quick update on my Harvard HIV WebXR visualization project!
Just enhanced the 3D HIV model with vibrant colors, dynamic 3D text labels for Harvard institutions that circle the central virus model.

Next up: Adding interaction and AR!
#Aframe
#WebXR
#DataViz
#SciComm
#ResearchVisualization
#3D
A gently rotating HIV structure on a cyberpunk colored cyan and blue color scheme encircled by a color coded graph and extruded 3D text that resembles buildings sticking out of the timeline that highlight the different Harvard Institutions that have made breakthroughs in the HIV space.
charitylovesxr.bsky.social
MILKY is a galaxy-inspired character created to help users explore research data in an immersive 3D environment. You can try out the functional prototype here: my.spline.design/aiassistantx...
@harvarddataverse.bsky.social @dataverseorg.bsky.social
charitylovesxr.bsky.social
Excited to share a glimpse of our latest collaboration-a ReactXR “space” version of the Dataverse (dataverse.org)!

A huge shoutout to Robert Christie, whose technical vision and expertise brought this concept to life.

Interested in joining us? The more the merrier, check out dataverse.org.
charitylovesxr.bsky.social
I had so much fun sharing how to use Spline.design to create 3D Embeddable Data Design with the Harvard University libraries. I can't wait to do our follow up of getting this up and running in WebXR.

We went from the GLED, to Kaggle, to ChatGPT, to Meshy, to Spline --> next stop Aframe! 😎
A data visualization 3d Blue tree of the GLED Celtic Languages Subtree on top of a colorful gradient map of Ireland and colorful nodes on the branches to signify high, medium, and low cognate density. The nodes cascade down and bounce on the gradient map. The scene moves around so you can see the 3d depth.
charitylovesxr.bsky.social
New Timeline Upgrade!
Just added AI-powered 3D modeling to our XR Guild timeline's Cyberspace section using MeshyAI

I'm presenting this and getting feedback from the XR Guild meeting today at 12pm [email protected] @juliankeyframe.bsky.social
charitylovesxr.bsky.social
Working with @xrguild.bsky.social on an interactive timeline of XR technology—here’s a first look at our mockup!
Explore the evolution of XR and let us know what you think:
glowing-connection-825090.framer.app/xr-guild-tim...

Feedback welcome!

@avibarzeev.bsky.social @juliankeyframe.bsky.social
charitylovesxr.bsky.social
Thanks so much! Can't wait to see more of what you do.
Reposted by CharityDataversiveXR
marcinignac.bsky.social
Graph as root of a procedural system.
charitylovesxr.bsky.social
Commenting so I can return and do something *FUNN* with this data.
charitylovesxr.bsky.social
Quick update on my Harvard HIV WebXR visualization project!
Just enhanced the 3D HIV model with vibrant colors, dynamic 3D text labels for Harvard institutions that circle the central virus model.

Next up: Adding interaction and AR!
#Aframe
#WebXR
#DataViz
#SciComm
#ResearchVisualization
#3D
A gently rotating HIV structure on a cyberpunk colored cyan and blue color scheme encircled by a color coded graph and extruded 3D text that resembles buildings sticking out of the timeline that highlight the different Harvard Institutions that have made breakthroughs in the HIV space.
Reposted by CharityDataversiveXR
datavisfriendly.bsky.social
Great collection! (Glad I'm there :))
infowetrust.com
How to start a data-graphics library, illustrated.

"Once one gets locked into a serious book collection, the tendency is to push it as far as you can." Details on each title here: www.chartography.net/p/how-to-sta...
charitylovesxr.bsky.social
Check out the project on GitHub:https://github.com/CharityEverett/orion-constellation-scatterplot and let me know your thoughts! #Astronomy #DataVisualization #OpenSource #OrionConstellation Feel free to adjust any details or add specific links as needed!
charitylovesxr.bsky.social
3D Visualization: Stars are represented as spheres in a captivating 3D space.
Axes Representation:
X-axis: Temperature (inverted)
Y-axis: Luminosity
Z-axis: Radius
Interactive Labels: Hover over stars to see their names!
charitylovesxr.bsky.social
What’s it all about? The scatterplot visualizes stellar properties sourced from a GeoJSON file that contains detailed information about various stars in the Orion cluster.
charitylovesxr.bsky.social
Let me share the (WIP) Orion Star Cluster Hertzsprung-Russell Scatterplot! Interactive 3D visualization showcases the stars in the Orion cluster based on their temperature, luminosity, and radius. Let’s dive in! #WebXR, #Aframe, #Datavizhttps://www.loom.com/share/f2ef94bc9a4b48c9b79637a78bb865c0
Current Project Update 🌟
Use Loom to record quick videos of your screen and cam. Explain anything clearly and easily – and skip the meeting. An essential tool for hybrid workplaces.
www.loom.com
charitylovesxr.bsky.social
I'm pretty sure it took you that long to download The Blueprint album.
charitylovesxr.bsky.social
Built with WebXR and Three.js, this project transforms portfolio browsing into an immersive journey. Those glowing hexagons? They're your gateways to different projects, each with its own unique story.
charitylovesxr.bsky.social
The concept: Navigate through a detailed 3D brain model where golden neurons act as interactive portals. Each hexagonal node you see represents a different project, connected by neural pathways.
charitylovesxr.bsky.social
Step inside my latest #WebXR creation - where neuroscience meets web development! Here's a sneak peek at my experimental portfolio that lets you explore projects through a 3D neural interface.