


Climate TRACE
@climatetrace.org
Climate TRACE is a non-profit coalition of organizations building a timely, open, and accessible inventory of exactly where greenhouse gas emissions are coming from.
Explore: ClimateTRACE.org/explore
Explore: ClimateTRACE.org/explore
Read today’s release to learn more about the latest global emissions data from Climate TRACE. climatetrace.org/news/climate...

Climate TRACE Releases September 2025 Emissions Data
November release 5.1.0 includes monthly emissions data now through September 2025.
climatetrace.org
November 25, 2025 at 9:34 PM
Read today’s release to learn more about the latest global emissions data from Climate TRACE. climatetrace.org/news/climate...
SELECTED SECTOR CHANGES - SEPTEMBER 2025 VS. SEPTEMBER 2024
📈Transportation emissions increased 3.35%
📈Waste emissions increased 4.08%
📉Agriculture emissions decreased 0.05%
📈Transportation emissions increased 3.35%
📈Waste emissions increased 4.08%
📉Agriculture emissions decreased 0.05%


November 25, 2025 at 9:34 PM
SELECTED SECTOR CHANGES - SEPTEMBER 2025 VS. SEPTEMBER 2024
📈Transportation emissions increased 3.35%
📈Waste emissions increased 4.08%
📉Agriculture emissions decreased 0.05%
📈Transportation emissions increased 3.35%
📈Waste emissions increased 4.08%
📉Agriculture emissions decreased 0.05%
Today’s data release paints a clear picture of global emissions for the first three quarters of 2025, where year-to-date emissions have reached 45.48 Bt, 0.96% higher than 2024’s year-to-date total.


November 25, 2025 at 9:34 PM
Today’s data release paints a clear picture of global emissions for the first three quarters of 2025, where year-to-date emissions have reached 45.48 Bt, 0.96% higher than 2024’s year-to-date total.
We’ve unpacked the research, gathered the data, and synthesized the results in a new white paper reviewing Climate TRACE findings from the #emissions reduction roadmap tool.
Read it here: media.climatetrace.org/Climate_TRAC...
Read it here: media.climatetrace.org/Climate_TRAC...

November 22, 2025 at 1:33 AM
We’ve unpacked the research, gathered the data, and synthesized the results in a new white paper reviewing Climate TRACE findings from the #emissions reduction roadmap tool.
Read it here: media.climatetrace.org/Climate_TRAC...
Read it here: media.climatetrace.org/Climate_TRAC...
See proven, accessible emissions reductions strategies capable of cutting global CO2e100 by 30 billion tonnes at ClimateTRACE.org/reduce.

Reduce Emissions
The data has shown us the way. Now it's time to act.
ClimateTRACE.org
November 12, 2025 at 6:01 PM
See proven, accessible emissions reductions strategies capable of cutting global CO2e100 by 30 billion tonnes at ClimateTRACE.org/reduce.
How does it work?
1. 🔗 ClimateTRACE.org/reduce
2. Add geography or sector of interest
3. Adjust the slider to set your target emissions reductions
4. Review relevant emissions reduction strategies
5. Identify facilities for implementation + view their locations on the emissions map
6. Take action
1. 🔗 ClimateTRACE.org/reduce
2. Add geography or sector of interest
3. Adjust the slider to set your target emissions reductions
4. Review relevant emissions reduction strategies
5. Identify facilities for implementation + view their locations on the emissions map
6. Take action
Reduce Emissions
The data has shown us the way. Now it's time to act.
ClimateTRACE.org
November 12, 2025 at 6:01 PM
How does it work?
1. 🔗 ClimateTRACE.org/reduce
2. Add geography or sector of interest
3. Adjust the slider to set your target emissions reductions
4. Review relevant emissions reduction strategies
5. Identify facilities for implementation + view their locations on the emissions map
6. Take action
1. 🔗 ClimateTRACE.org/reduce
2. Add geography or sector of interest
3. Adjust the slider to set your target emissions reductions
4. Review relevant emissions reduction strategies
5. Identify facilities for implementation + view their locations on the emissions map
6. Take action
By identifying emissions reduction strategies for each emitting source on the Climate TRACE emissions map, anyone who wants to reduce emissions can now identify opportunities and quantify the impact with the emissions reduction roadmap tool.
November 12, 2025 at 6:01 PM
By identifying emissions reduction strategies for each emitting source on the Climate TRACE emissions map, anyone who wants to reduce emissions can now identify opportunities and quantify the impact with the emissions reduction roadmap tool.
Read more about the latest emissions data in the release: climatetrace.org/news/climate...

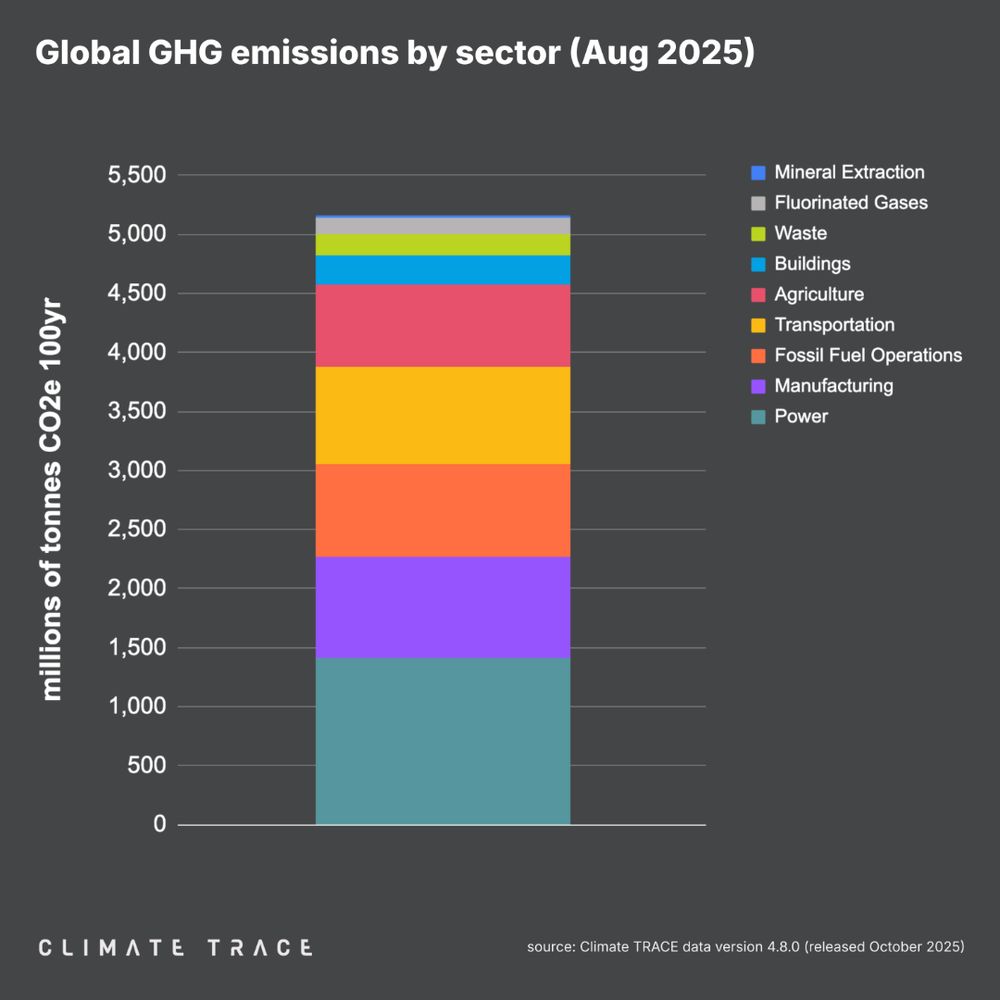
Climate TRACE Releases August 2025 Emissions Data
October release 4.8.0 includes monthly emissions data now through August 2025.
climatetrace.org
October 30, 2025 at 5:27 PM
Read more about the latest emissions data in the release: climatetrace.org/news/climate...
SECTOR DATA, August 2025 vs. August 2024:
📈Power sector emissions increased 0.44%
📉Fossil fuel operations emissions declined 1.88%
📈Transportation sector emissions increased 3.6%
📈Power sector emissions increased 0.44%
📉Fossil fuel operations emissions declined 1.88%
📈Transportation sector emissions increased 3.6%

October 30, 2025 at 5:27 PM
SECTOR DATA, August 2025 vs. August 2024:
📈Power sector emissions increased 0.44%
📉Fossil fuel operations emissions declined 1.88%
📈Transportation sector emissions increased 3.6%
📈Power sector emissions increased 0.44%
📉Fossil fuel operations emissions declined 1.88%
📈Transportation sector emissions increased 3.6%
Total global year-to-date emissions are 41.09 Bt through August, which is 0.3% higher than 2024’s year-to-date total for the same timeframe.

October 30, 2025 at 5:27 PM
Total global year-to-date emissions are 41.09 Bt through August, which is 0.3% higher than 2024’s year-to-date total for the same timeframe.
Although four of the top five emitting countries saw slight increases in emissions year over year, US emissions decreased by 4.54%, as compared to August 2024.
October 30, 2025 at 5:27 PM
Although four of the top five emitting countries saw slight increases in emissions year over year, US emissions decreased by 4.54%, as compared to August 2024.
If you have more questions about the tool, please take a look through the FAQ page: climatetrace.org/news/plumes-.... Stay tuned for more developments as we continue to build out these capabilities.

Plumes Frequently Asked Questions
Climate TRACE has developed a global air emissions dataset that provides unprecedented transparency into greenhouse gas (GHG) and non-GHG emissions. To further illuminate the direct impacts of air pol...
climatetrace.org
October 29, 2025 at 9:23 PM
If you have more questions about the tool, please take a look through the FAQ page: climatetrace.org/news/plumes-.... Stay tuned for more developments as we continue to build out these capabilities.
The plumes are modeled based on conditions of an average day or worst conditions day, and the animation plays over a 24-hour period. Take a look at the info box on the bottom left to see time stamps.

October 29, 2025 at 9:23 PM
The plumes are modeled based on conditions of an average day or worst conditions day, and the animation plays over a 24-hour period. Take a look at the info box on the bottom left to see time stamps.