Cole 🐛
@colebaril.ca
370 followers 200 following 140 posts
📈 Data Analyst | #RStats Programmer 👨‍💻 🦋 MSc | Medical Entomology 🦟 💪 Gym | 🧁Baking | Gamer 🎮 🌈 he/him 📍YWG
Posts Media Videos Starter Packs
Pinned
colebaril.ca
Starting October 1! I have been a busy beaver curating spooky datasets!

#RStats #ggplot2 #DataViz #R #Tidyverse
Illustration for ‘Spooktober: Data After Dark’ featuring cute cartoon ghosts, flying bats, carved pumpkins, and colorful Tidyverse package logos scattered across a purple background, creating a playful Halloween and data science theme.
colebaril.ca
🎃👻 Spooktober: Data After Dark - October 7

Today's plot shows inflation adjusted U.S. Halloween spending across 4 categories from 2005 to 2025 (2025 anticipated).

#Spooktober #DataViz #R #ggplot2 #RStats #Tidyverse #Retail #Halloween
colebaril.ca
To get this data, I scraped all store locations off their website and used {stringdist} and {tidygeocoder} to geo-tag each location to allow them to be mapped. Full scraping and cleaning script can be found here: github.com/colebaril/da...
colebaril.ca
Spirit Halloween’s reach spans across North America, with the highest density of stores in the eastern U.S. and major metropolitan regions. Its presence thins in rural and northern areas, reflecting population distribution and retail availability.
colebaril.ca
🎃👻 Spooktober: Data After Dark - October 6

Spirit Halloween stores seem to pop up almost everywhere out of nowhere. I wanted to see just how ubiquitous these temporary shops are across North America.

#Spooktober #DataViz #R #ggplot2 #RStats #Tidyverse #SpiritHalloween #Retail #Halloween
A map of North America showing the distribution of Spirit Halloween stores using purple circles sized by store count. The highest concentrations appear along the eastern United States, particularly around the Great Lakes, the Northeast, and the southeastern states. Dense clusters also appear around major U.S. cities such as Los Angeles, Dallas, and Chicago, while western Canada has smaller clusters near Vancouver, Calgary, and Edmonton. Northern Canada, the northern U.S. plains, and remote regions show few or no stores. The map highlights how Spirit Halloween stores are most common in densely populated urban and suburban areas.
colebaril.ca
Yes, it is my package. It is only used for plot themes and captions w/ html customization to make my life easier, so not necessary at all.
colebaril.ca
Chocolatey, nutty, caramely bars reign supreme (Reese's, Twix, Kit Kat, Snickers, etc). Although fruity assortments of candy (e.g., Skittles, Starburst) also are popular on their own.

Read more here: rpubs.com/colebaril/sp...
RPubs - Spooktober 2025
rpubs.com
colebaril.ca
🎃👻 Spooktober: Data After Dark - October 5

Want to know which Halloween candy is most popular? Look no further. This Halloween candy constellation plot shows which candy traits are the most popular together.

#Spooktober #DataViz #R #ggplot2 #RStats #Tidyverse #HalloweenCandy #Candy #TrickOrTreat
colebaril.ca
This breaks my heart. I had to say goodbye to the dog I grew up with recently. I framed it to myself as we experience sadness so they don’t have to and can rest and be pain free. You gave her the best life and she was lucky to have you. 🫂
colebaril.ca
This makes me wonder if all the other states started producing pumpkins after the drastic decrease in production by Illinois in 2014 🤔
colebaril.ca
Interestingly, the drastic drop in pumpkin production in 2014 was attributed to abnormally wet conditions that year: archive.attn.com/stories/3884...
colebaril.ca
To make the gif, I used a combination of {gganimate} and {gifski}. Due to how html is rendered, I had to sacrifice some of the usual elements I add to plots.

I also discovered {ggnewscale} which supports different scales for the same type (e.g., size).

Read more here: rpubs.com/colebaril/13...
RPubs - Spooktober 2025
rpubs.com
colebaril.ca
I'm not entirely sure why several states (e.g., PNW, TX) only appear in around 2015 - it is unclear as to whether data collection only started for those states then, or they did not grow pumpkins to that point.
Line chart showing U.S. pumpkin production by state from 2000 to 2024. Illinois is highlighted in orange and consistently leads all other states, producing between ~150M and 320M kilograms annually, with fluctuations and notable spikes around 2014 and 2017. Other top states include California, Michigan, Ohio, and Pennsylvania andproduce substantially less, mostly between 20M and 100M kilograms. Decorative pumpkin icons appear near the chart title.
colebaril.ca
🎃👻 Spooktober: Data After Dark - October 4

Today, I looked into U.S. pumpkin production. Illinois dominates in the U.S. due to its ideal soil type and favourable conditions for pumpkin growing.

#Spooktober #DataViz #RStats #Tidyverse #Pumpkins #Pumpkin
colebaril.ca
Almost non-stop lightning—in October.

#mbwx #mbstorm
colebaril.ca
Interestingly, when I graphed the number of haunted places per capita, the graph completely reversed: there are more haunted places per capita in the least populous states.
Bubble scatter plot of U.S. states showing state population (x-axis) versus haunted places per capita (y-axis). Bubble size represents the total number of haunted places. Smaller-population states like Wyoming, Vermont, South Dakota, and North Dakota have the highest per-capita haunted sites, while large states like California and Texas have many haunted places overall but low per-capita density. Title includes a cartoon haunted house with a ghost.
colebaril.ca
Sure enough, there is a clear pattern. The more people in a state, the more haunted places. Perhaps this is due to more people to report haunted places, or more entities to do the haunting...
Scatter plot of U.S. states showing the relationship between state population (x-axis) and the number of haunted places (y-axis). Larger-population states generally have more haunted locations. California and Texas stand out with the most hauntings, while Pennsylvania, Ohio, New York, and Michigan are also high. Smaller states like Kentucky, Indiana, and Massachusetts are highlighted as well. Title includes a cartoon pumpkin with bats.
colebaril.ca
🎃👻 Spooktober: Data After Dark - October 3

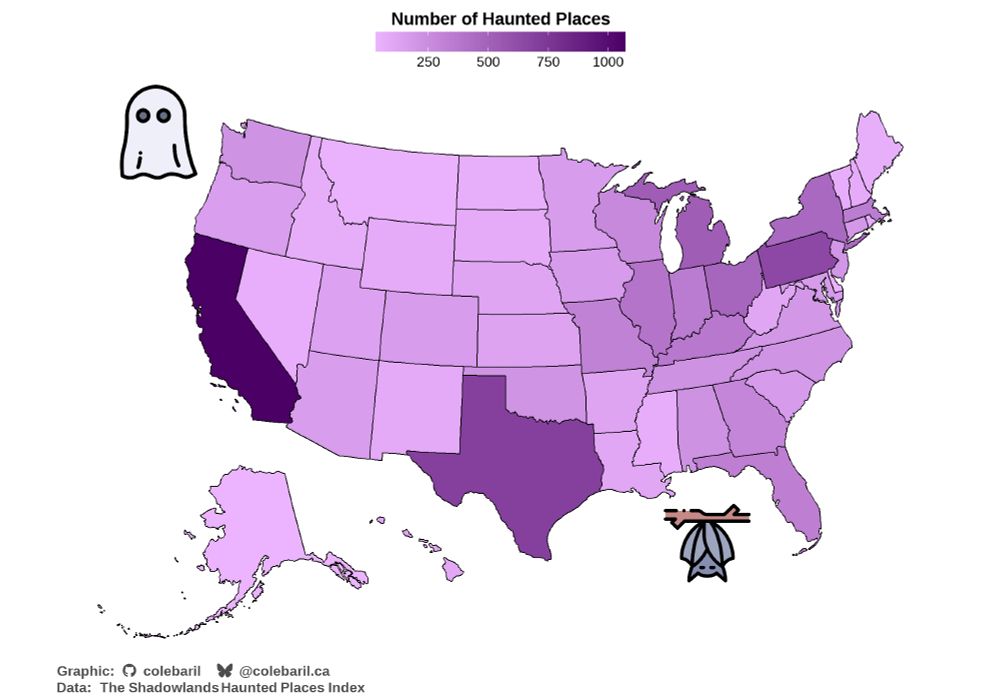
Today, I looked at the number of haunted places in each U.S. state. CA and TX have the highest number of haunted places. Does this have something to do with population...?

#Spooktober #DataViz #RStats #Tidyverse #Hauntings #HauntedHouse
Choropleth map of the United States shaded by the number of haunted places. Darker purple indicates more haunted sites. California, Texas, and Pennsylvania show the darkest shades with the most hauntings, while many western and plains states are lighter with fewer. A ghost icon is placed over the northwest and a bat hangs upside down in the southeast corner.
Reposted by Cole 🐛
colebaril.ca
🎃👻 Spooktober: Data After Dark - October 1 🧵

Kicking off this spooky data series by looking at when horror movies are released.

Unsurprisingly, October dominates! From the 2000s onward, October became the clear peak for horror releases.

#Spooktober #DataViz #RStats #Tidyverse #HorrorMovies
A heatmap titled Calendar of Creeps: Horror Releases by Month. The x-axis shows months (January–December), and the y-axis shows years (1980–2022). Each cell’s color represents the number of horror movies released that month, with darker orange meaning more releases. The chart shows a clear peak in October, especially after 2000, and a second, surprising cluster of releases in January.
colebaril.ca
🎃👻 Spooktober: Data After Dark - October 2

Continuing off yesterday's theme of horror movies, for today's graphic I made a word cloud from >32K horror movie titles using the tidytext and wordcloud2 packages.

#Spooktober #DataViz #RStats #Tidyverse #HorrorMovies
A word cloud created from >32K horror movie titles using R’s tidytext and wordcloud2 packages. Words are arranged in an oval shape on a black background, sized by frequency and colored in red, orange, and yellow. The largest words include “dead,” “night,” “house,” “blood,” “ghost,” “death,” “vampire,” and “zombie,” with smaller related words like “killer,” “curse,” “terror,” “hell,” “monster,” and “massacre.”