CW3E Scripps
@cw3escripps.bsky.social
670 followers 3 following 94 posts
The Center for Western Weather and Water Extremes of Scripps Institution of Oceanography at UC San Diego cw3e.ucsd.edu
Posts Media Videos Starter Packs
Pinned
cw3escripps.bsky.social
Hi there 👋 we're the Center for Western Weather and Water Extremes (CW3E) of @scrippsocean.bsky.social at @ucsandiego.bsky.social

We'll be posting our latest AR Outlooks, news items, and updates on our research into atmospheric rivers and precip extremes. For more info visit: cw3e.ucsd.edu
cw3escripps.bsky.social
A predecessor rain event associated with the moisture from Hurricane Priscilla is forecast to bring rainfall to Arizona and New Mexico Thu-Sat, followed by additional precipitation associated with an upper-level trough, which may continue into early next week. Read more here: go.ucsd.edu/4q0WYM9
cw3escripps.bsky.social
CW3E Publication Notice: "Leveraging the Atmospheric River Framework to Categorize Top-Decile Precipitation Regimes in Colorado" in @agu.org 's Geophysical Research Letters. Read more about this research: cw3e.ucsd.edu/cw3e-publica...
cw3escripps.bsky.social
Multiple #AtmosphericRivers and a complex storm system brought several rounds of precipitation to the western US over the past week.

For a brief synopsis of these weather events, visit: cw3e.ucsd.edu/wp-content/u....
National Weather Service (NWS) Stage IV quantitative precipitation estimate (QPE) for the 48-hour period ending 5 AM PDT 30 Sep 2025 (left) and the 96-hour period ending 5 AM PDT 4 Oct 2025 (right).
cw3escripps.bsky.social
A trough and remnant moisture from the atmospheric river (AR) that made landfall over the Pacific Northwest on Tuesday drives precipitation over the Sierra Nevada, Great Basin and, Southern Idaho today into tomorrow.
Check out our latest Quick Look for more information: cw3e.ucsd.edu/wp-content/u...
Page one of the quick look featuring forecast highlights. Page two of the quick look. On top are select images of IVT from the Global Forecast System (GFS) showing the propagation of the IVT driving the system. On bottom is CW3E's Landfall Tool showing the percentage of members from the GEFS that have IVT > 150 kg m-1 s-2 along the US West Coast in the next 16 days. Page three of the quick  look. On top are 24-hour forecasts from the Weather Prediction Center for periods ending at 5 AM on 3 (left) and 4 (right) October. The bottom left image is the percentage of water year normal precipitation accumulation based on the National Blend of Models 7-day precipitation. The bottom right image shows the drought conditions for the Western US from the Drought Monitor.
cw3escripps.bsky.social
CW3E Publication Notice: "Observing atmospheric rivers using multi-GNSS airborne radio occultation: system description and data evaluation" in @egu.eu's Atmospheric Measurement Techniques.

For a summary of this paper, visit: cw3e.ucsd.edu/cw3e-publica....
Figure 5 from Cao et al. (2025). Overview of IOP04 (4 Feb 2020): flight track (thin black line), dropsonde releases (black circles), and setting/rising ARO tangent-point paths (solid/dashed blue lines) over integrated vapor transport (IVT), with symbols marking lowest-altitude class and short segments indicating the ray-path portion contributing 50% of excess phase.
cw3escripps.bsky.social
CW3E Publication Notice: "Improving Weeks 1-2 Temperature Forecasts in the Sierra Nevada Region Using Analog Ensemble Post-Processing with Implications for Better Prediction of Snowmelt, Water Storage, and Streamflow" in @ametsoc.org's Journal of Hydrometeorology.
Figure 6 from Yang et al. (2025). Temporal correlations, RMSE (unit: °C), and CRPS (unit: °C) of AnEn forecasts minus temporal correlations, RMSE (unit: °C), and CRPS (unit: °C) of GEFS in each station at 1-day to 5-day lead (left column), 6-day to 10-day lead (middle column), and 11-day to 15-day lead (right column).
cw3escripps.bsky.social
An active weather pattern will continue over the U.S. West Coast through mid-week, with another #AtmosphericRiver and a strong low-pressure system bringing additional precipitation to the region.

See our latest Quick Look for more information: cw3e.ucsd.edu/wp-content/u....
Page 1 of Quick Look. Summary of key forecast information. Page 2 of Quick Look. GFS integrated water vapor transport (shading and vectors) and sea-level pressure (contours) forecasts valid at 2 pm PDT 29 Sep (top left), 11 am PDT 30 Sep (top right), 5 am PDT 1 Oct (bottom left), and 11 pm PDT 1 Oct (bottom right). Page 3 of Quick Look. (Top) (Bottom) GEFS control 7-day AR Scale and ensemble IVT plumes at 38.0°N, 123°W (left) and 47.5°N, 124.5°W (right). (Bottom) CW3E's AR Landfall tool based on GEFS showing the probability of AR conditions [IVT ≥ 250 kg/(ms)] along the West Coast of North America during the next 16 days. Page 4 of Quick Look. (Top) NWS Weather Prediction Center (WPC) quantitative precipitation forecasts (QPF) and excessive rainfall outlooks (EROs) valid for the 24-hour periods ending 5 am PDT 30 Sep (left) and 5 am PDT 2 Oct (center). NWS WPC total QPF valid for 72-hour period ending 5 am PDT 2 Oct (right). (Bottom) Current drought conditions (left) and active large fires (right) in Washington.
cw3escripps.bsky.social
An active weather pattern is expected to return to the US West Coast later this weekend, with the potential for multiple #AtmosphericRiver landfalls through late next week.

Check out our latest Quick Look for more information: cw3e.ucsd.edu/wp-content/u....
CW3E's AR Landfall Tool based on the Global Ensemble Forecast System (GEFS). Shading indicates the probability of AR conditions [IVT≥250 kg/(ms)] along the West Coast of North America over the next 16 days.
cw3escripps.bsky.social
A cutoff low currently offshore of California is forecast to move over the Desert Southwest and interact with an area of monsoonal moisture, producing significant precipitation over the region late this week into the weekend.

See our latest Quick Look for more info: cw3e.ucsd.edu/wp-content/u...
cw3escripps.bsky.social
Moisture from the remnants of Tropical Storm Mario fueled showers and thunderstorms over portions of CA, NV, and AZ last week. Flash flooding and landslides were reported in Imperial, San Bernardino, and Kern Counties.

For a brief synopsis of this event, visit: cw3e.ucsd.edu/wp-content/u....
Left: GFS integrated water vapor (IWV; shading), sea-level pressure (SLP; contours), and 850-hPa wind (barbs) analysis valid at 5 PM PDT 17 Sep 2025. Right: National Weather Service (NWS) Stage IV quantitative precipitation estimate (QPE) for the 72-hour period ending 5 AM PDT 20 Sep 2025.
cw3escripps.bsky.social
The remnants of Tropical Storm Mario are forecast to bring showers and thunderstorms to portions of the southwestern US this week. Heavy downpours could result in localized flashed flooding. #CAwx

See our latest Quick Look for more information: cw3e.ucsd.edu/wp-content/u....
Page 1 of Quick Look. Summary of key forecast information. Page 2 of Quick Look. (Top left) National Hurricane Center Advisory #17 and forecast cone for Tropical Storm Mario, issued at 8 AM PDT Tue 16 Sep. (Top right) GFS integrated water vapor (IWV; shading), sea-level pressure (SLP; contours), and 850-hPa wind (barbs) forecasts valid at 5 AM PDT Thu 18 Sep. (Bottom) NWS Weather Prediction Center (WPC) quantitative precipitation forecasts (QPF) and excessive rainfall outlooks (EROs) valid for the 24-hour periods ending 5 AM PDT Fri 19 Sep (left) and 5 AM PDT Sat 20 Sep (center). NWS WPC total QPF valid for 72-hour period ending 5 AM PDT Sat 20 Sep (right).
Page 3 of Quick Look. (Top) 75th (left) and 90th (right) percentiles of 72-hour total forecast precipitation from the West-WRF ensemble, valid at 5 PM PDT Fri 19 Sep. (Bottom left) Map showing GFS deterministic 10-day mean areal precipitation forecasts for watersheds in California, southern Nevada, and western Arizona. (Bottom right) Deterministic and ensemble 10-day mean areal precipitation forecasts for the Los Angeles watershed.
cw3escripps.bsky.social
CW3E Publication Notice: “Atmospheric River Reconnaissance: Mission Planning, Execution, and Incorporation of Operational and Science Objectives” in @ametsoc.org's BAMS.

For a summary of this paper, visit: cw3e.ucsd.edu/cw3e-publica....
Flight tracks and geographical distribution of the data collected from Atmospheric River Reconnaissance 2024 intensive observing period (hereafter, IOP) 24, centered at 0000 UTC 23 January 2024. Red stars indicate departing airports. Background meteorological fields are based on ERA-5 reanalysis data valid at 0000 UTC 23 January 2024. Shades with gray contours: Integrated vapor transport (IVT) magnitude [kg/(ms)]. Black dashed contours: mean sea level pressure (MSLP; hPa) with an interval of eight hPa. Cyan/green filled circles: locations of actual/planned dropsondes collected during this IOP mission. Dark green lines: Airbone radio occultation (ARO) slanted profiles, with the highest point at the flight track and the lowest part at the end of the line furthest from the flight track. Figure 1 from Zheng et al. (2025).
cw3escripps.bsky.social
CW3E Publication Notice: “Atmospheric Rivers and Floods in California’s Changing Hydroclimate” in San Francisco Estuary and Watershed Science. To read more about this research, visit: cw3e.ucsd.edu/cw3e-publica...
cw3escripps.bsky.social
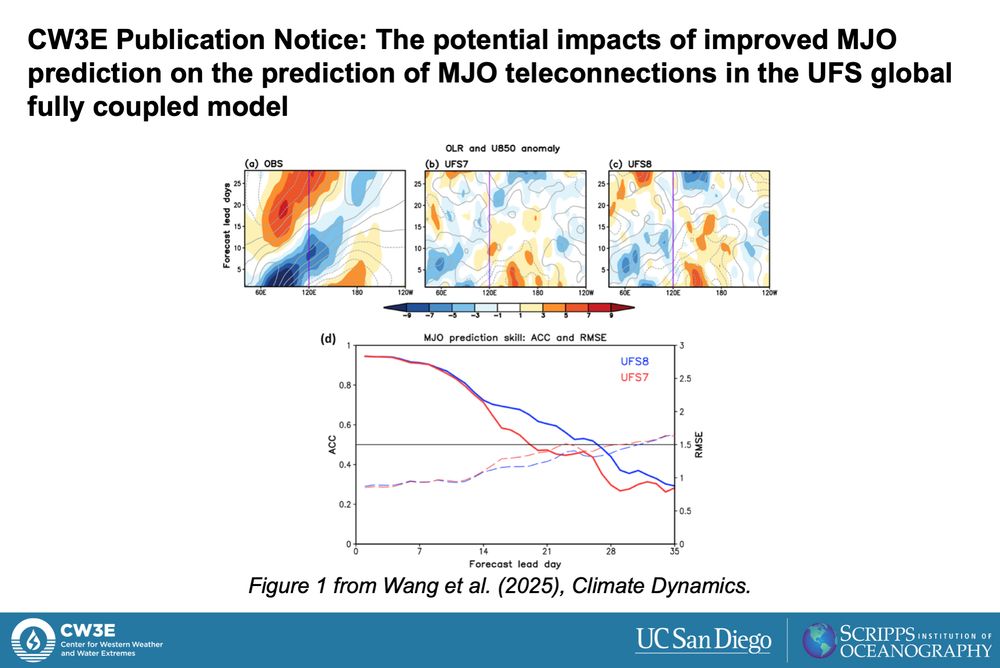
CW3E Publication Notice: “The potential impacts of improved MJO prediction on the prediction of MJO teleconnections in the UFS global fully coupled model” in Climate Dynamics.

For a summary of this paper, visit: cw3e.ucsd.edu/cw3e-publica....
(a–c) Longitude-time composites of outgoing longwave radiation (OLR; shading; W/m^2) and 850-hPa zonal wind (U850; contours; interval 0.3 m/s) anomalies averaged over 15° S–15° N for active MJO events in reanalysis, UFS7, and UFS8, respectively. The results are for events initialized during MJO phases 2 and 3. The vertical lines indicate 120°E (approximately the center of the Maritime Continent). A 5-day moving average is applied. (d) MJO prediction skill for UFS7 and UFS8 reforecasts initialized with active MJO events. The prediction skill is evaluated based on ACC (solid lines) and RMSE (dashed lines) between the model and reanalysis RMM indices. The gray solid horizontal line indicates an ACC of 0.5. From Figure 1 in Wang et al. (2025).
cw3escripps.bsky.social
CW3E Publication Notice: “Impacts of atmospheric river reconnaissance dropsondes on ECMWF Integrated Forecasting System precipitation forecasts” in the Quarterly Journal of the Royal Meteorological Society.

For a summary of this paper, visit: cw3e.ucsd.edu/cw3e-publica....
The percentage differences (%) between the control experiments (CTRL) and the denial experiments (noDROP) for (a–c) Gilbert Skill Score (GSS), (d–f) Spearman's rank correlation coefficient (SCC), and (g–i) root-mean-squared error (RMSE) for the two seasons combined. Half-filled cells represent absolute percentage differences smaller than 0.5%. For the GSS and SCC, the difference is CTRL − noDROP, while for the RMSE, the difference is noDROP − CTRL. Thus, green represents improvement from dropsondes, and brown indicates degradation. The left, middle, and right columns correspond to the California (CA), Pacific Northwest (PNW), and WEST verification domains, respectively. The x-axis represents thresholds for 24-hour accumulated precipitation. Values with frames are those passing the significance test, using the 90% confidence interval. Figure credit: Figure 5 of Wang et al. (2025).
cw3escripps.bsky.social
❓Questions? Contact Dr. Minghua Zheng: [email protected]
cw3escripps.bsky.social
#PostdocOpportunityCW3E

Scripps Institution of Oceanography (UC San Diego) is seeking a Postdoctoral Researcher in Atmospheric Data Assimilation.

📄 Details: scripps.ucsd.edu/system/files...
scripps.ucsd.edu
cw3escripps.bsky.social
CW3E Publication Notice: “A Trajectory-Based Method for Estimating the Contribution of Landfalling Atmospheric Rivers to Top-Decile Precipitation Across Colorado” in @agu.org's Journal of Geophysical Research: Atmospheres.

For a summary of this paper, visit: cw3e.ucsd.edu/cw3e-publica....
A schematic showing the three most frequent pathways of cool-season landfalling atmospheric river (AR) trajectories. The bubbles on the coast show the relative number of landfalling ARs associated with top-decile precipitation days in Colorado sub-basins.
cw3escripps.bsky.social
An unusually strong summertime #AtmosphericRiver brought AR 3 conditions and heavy rainfall to portions of western Washington last week. #WAwx

See our latest quick summary for a brief synopsis of this event: cw3e.ucsd.edu/wp-content/u....
Left: Maximum observed AR Scale along the coast for the 7-day period ending 11 PM PDT 17 Aug 2025 (based on 6-hourly GEFS control analyses). Right: National Weather Service (NWS) Stage IV quantitative precipitation estimate (QPE) for the 48-hour period ending 5 PM PDT 16 Aug 2025.
cw3escripps.bsky.social
An atmospheric river (AR) is forecast to make landfall over the Pacific Northwest Thursday evening, driving heavy precipitation over western Washington through Saturday.

See our latest quick look for more information: cw3e.ucsd.edu/wp-content/u...
Page one of the quick look showing forecast highlights. Page two of the quick look. On top are select GFS IVT images showing the propagation of the AR across the northeast Pacific. On bottom is CW3E's landfall tool based on the GEFS showing high probability of AR conditions along the Pacific Northwest coast. Page three of the quick look. On top is GEFS AR Scale forecast for a point along the Washington/Oregon border showing moderate probability of AR3+ conditions. On bottom is WPC forecast precipitation for 15-17 Aug. Page four of the quick look. On top  are model and ensemble precipitation forecasts for two select watersheds in Washington: Queens-Quinault (left, Washington Coast) and Skykomish(Right, Cascade foothills). On bottom are the observed drought conditions in the Pacific Northwest.
cw3escripps.bsky.social
CW3E Publication Notice: "Characteristics and Predictability of Extreme Precipitation Related to Atmospheric Rivers, Mesoscale Convective Systems, and Tropical Cyclones in the U.S. Southeast" in @agu.org's Journal of Geophysical Research: Atmospheres.
Pattern‐wise composites of atmospheric river (AR) probability computed using the Tracking ARs Globally as Elongated Targets (tARget) algorithm, and SLP (contoured every 2 hPa). Purple dots represent tropical cyclone locations obtained from the National Hurricane Center’s Atlantic Hurricane Database (HURDAT). From Figure 7 in Battula et al. (2025).
cw3escripps.bsky.social
CW3E Publication Notice: "A Case Study of Forecast Uncertainty Prior to a High-Impact Landfalling Atmospheric River in California in January 2021" in @ametsoc.org's Weather and Forecasting.

For a summary of this paper, visit: cw3e.ucsd.edu/cw3e-publica....
Figure 9 from Cordeira et al. 2025. Left panels illustrate lead-time–coastal latitude “dProg/dt” analysis of the (a) GFS ensemble and (b) ECMWF ensemble forecast probability of IVT magnitude ≥250 kg/(ms) (shading as a fraction) and ensemble mean IVT magnitude (contoured every 100 kg/(ms)  starting at 100 kg/(ms) for locations along the West Coast of North America for forecasts all verifying at 0000 UTC 28 January 2021. Right map panels illustrate IVT magnitude shaded yellow at 250 kg/(ms) and orange at 500 kg/(ms) from the corresponding model analyses (0-h control forecast). The analysis is derived from the coastal locations drawn in the right panels; the locations are drawn black for IVT magnitudes <250 kg/(ms) and red for IVT magnitudes ≥250 kg/(ms) at 0000 UTC 28 January 2021. The black box on left panels denotes the 6-to-10-day lead time discussed in the text.
cw3escripps.bsky.social
The Scripps Institution of Oceanography is recruiting for an Assistant, Associate, or Full Researcher in Meteorology. This full-time academic appointment is similar to the tenure-track ranks of an academic professorship appointment. apol-recruit.ucsd.edu/JPF04327
Assistant, Associate, or Full Research Meteorologist
University of California, San Diego is hiring. Apply now!
apol-recruit.ucsd.edu