


Dan Olner
@danolner.bsky.social
Policy fellow @Y_PERN_ @SouthYorksMCA Data scientist / geospatial+economics / climate / political economy / "tepid centrist" / bit of sci-fi too danolner.net github.com/DanOlner
... what their own eyes tell them seems to be highly party-dependent. www.nytimes.com/2026/01/22/u...

January 22, 2026 at 4:24 PM
... what their own eyes tell them seems to be highly party-dependent. www.nytimes.com/2026/01/22/u...
Someone should get Donald to have a play with thetruesize website. (As if objective reality plays any part in that man's mind...) thetruesize.com#?borders=1~!... #greenland
January 20, 2026 at 1:39 PM
Someone should get Donald to have a play with thetruesize website. (As if objective reality plays any part in that man's mind...) thetruesize.com#?borders=1~!... #greenland
The Obamas in Selma, Alabama, March 2015. More on the Obama Whitehouse archived page. obamawhitehouse.archives.gov/blog/2015/03...

January 19, 2026 at 1:31 PM
The Obamas in Selma, Alabama, March 2015. More on the Obama Whitehouse archived page. obamawhitehouse.archives.gov/blog/2015/03...
To be fair to DHS, they're doing the same thing quite openly on the front page of their website. www.dhs.gov

January 12, 2026 at 3:01 PM
To be fair to DHS, they're doing the same thing quite openly on the front page of their website. www.dhs.gov
The actual front page of the actual US Homeland Security dept. www.dhs.gov

January 9, 2026 at 1:41 PM
The actual front page of the actual US Homeland Security dept. www.dhs.gov
🧪#R code-sharing experiment🧪: this plot shows sector economic output as blocks: jobs * output-per-job (West Yorkshire ITL3s). It’s made in a self-contained R file that you can run yourself, changing geographies, times etc. Online slides explain how here: danolner.github.io/RegionalEcon... 1/3

December 3, 2025 at 1:59 PM
🧪#R code-sharing experiment🧪: this plot shows sector economic output as blocks: jobs * output-per-job (West Yorkshire ITL3s). It’s made in a self-contained R file that you can run yourself, changing geographies, times etc. Online slides explain how here: danolner.github.io/RegionalEcon... 1/3
Still very fond of this paragraph. Seven years old now, good lord. Via www.danolner.net/2018/09/hone...

November 19, 2025 at 4:29 PM
Still very fond of this paragraph. Seven years old now, good lord. Via www.danolner.net/2018/09/hone...


OK, better from the Guardian.

September 23, 2025 at 2:34 PM
OK, better from the Guardian.
Wes Streeting actually pitching this right. Guardian/NYT fluffing it. Streeting: "There is no evidence to link the use of paracetamol by pregnant women to autism in their children. None." Guardian: "Highly contentious conclusions" (nope, false conclusions). NYT: "Unproven link." Sigh...

September 23, 2025 at 9:27 AM
Wes Streeting actually pitching this right. Guardian/NYT fluffing it. Streeting: "There is no evidence to link the use of paracetamol by pregnant women to autism in their children. None." Guardian: "Highly contentious conclusions" (nope, false conclusions). NYT: "Unproven link." Sigh...
Starmer today. I can't tell which is worse - the fact he's saying it, or the fact it reveals he's just an empty human weathervane, flapping in whatever direction reactionary winds happen to be blowing. What a year. I've gone from hope to disappointment to outright horror with this govt.

May 12, 2025 at 11:04 AM
Starmer today. I can't tell which is worse - the fact he's saying it, or the fact it reveals he's just an empty human weathervane, flapping in whatever direction reactionary winds happen to be blowing. What a year. I've gone from hope to disappointment to outright horror with this govt.


And here's some data for that. Via www.ft.com/content/8459...

April 14, 2025 at 10:11 AM
And here's some data for that. Via www.ft.com/content/8459...
*Really* don't want to be defending tories here but... their austerity plan (drop deficit to begin to lower debt) *did* start doing that (args that tot wrong way to do that; should have done opposite of austerity, but...) It's COVID that stuffed that, borrowing to stop economy collapsing. Isn't it?

March 26, 2025 at 12:56 PM
*Really* don't want to be defending tories here but... their austerity plan (drop deficit to begin to lower debt) *did* start doing that (args that tot wrong way to do that; should have done opposite of austerity, but...) It's COVID that stuffed that, borrowing to stop economy collapsing. Isn't it?
#map of the day: every GB postcode location, with a bit of alpha, nicely revealing population density / where to go if you want to do any undisturbed primal screaming...

March 19, 2025 at 2:47 PM
#map of the day: every GB postcode location, with a bit of alpha, nicely revealing population density / where to go if you want to do any undisturbed primal screaming...
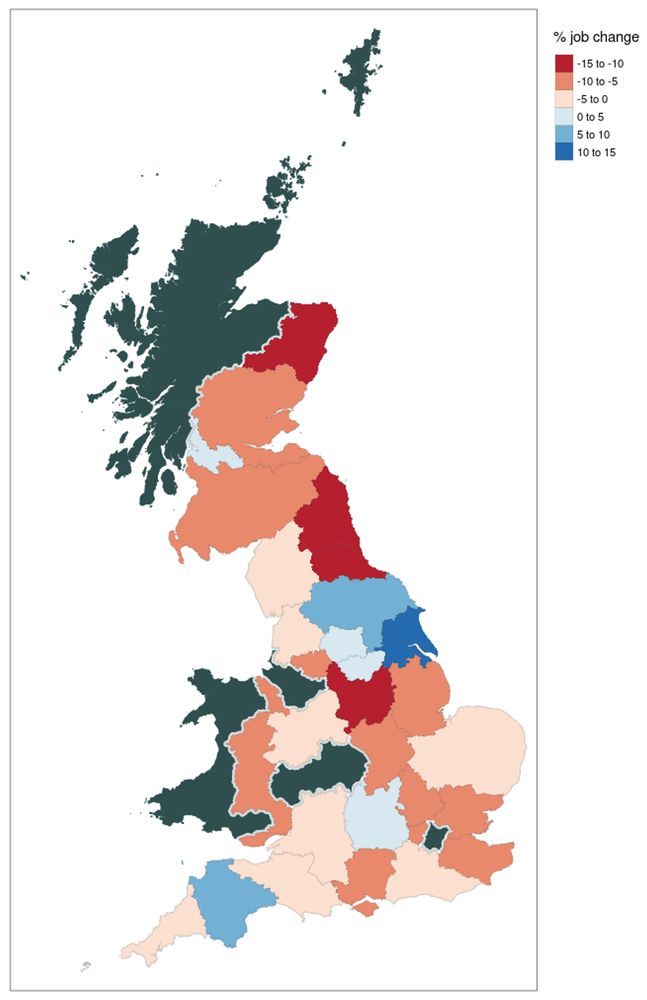
#Map of the day: in all non-grey places, manufacturing output (GVA) grew 2015/17-2020/22 (i.e. almost everywhere). But 𝐨𝐧𝐥𝐲 𝐢𝐧 𝐭𝐡𝐞 𝐛𝐥𝐮𝐞 zones 𝐝𝐢𝐝 𝐣𝐨𝐛𝐬 𝑎𝑙𝑠𝑜 𝐫𝐢𝐬𝐞. Yorkshire is the 𝑜𝑛𝑙𝑦 𝑙𝑎𝑟𝑔𝑒 𝑟𝑒𝑔𝑖𝑜𝑛𝑎𝑙 𝑐𝑙𝑢𝑠𝑡𝑒𝑟 where output & jobs grew together. (Red places: output grew, job numbers dropped) ...
February 25, 2025 at 4:33 PM
#Map of the day: in all non-grey places, manufacturing output (GVA) grew 2015/17-2020/22 (i.e. almost everywhere). But 𝐨𝐧𝐥𝐲 𝐢𝐧 𝐭𝐡𝐞 𝐛𝐥𝐮𝐞 zones 𝐝𝐢𝐝 𝐣𝐨𝐛𝐬 𝑎𝑙𝑠𝑜 𝐫𝐢𝐬𝐞. Yorkshire is the 𝑜𝑛𝑙𝑦 𝑙𝑎𝑟𝑔𝑒 𝑟𝑒𝑔𝑖𝑜𝑛𝑎𝑙 𝑐𝑙𝑢𝑠𝑡𝑒𝑟 where output & jobs grew together. (Red places: output grew, job numbers dropped) ...
One of world's richest men continually punches poor people, blames the poor people for being punched. This guy's just a really shit Batman.

February 18, 2025 at 9:38 AM
One of world's richest men continually punches poor people, blames the poor people for being punched. This guy's just a really shit Batman.
What an opening sentence. (From "British Political History, Pearce + Stewart.)

January 31, 2025 at 2:29 PM
What an opening sentence. (From "British Political History, Pearce + Stewart.)
Eowyn rainfall pattern is rather beautiful, in the abstract... via @metoffice.bsky.social

January 23, 2025 at 3:08 PM
Eowyn rainfall pattern is rather beautiful, in the abstract... via @metoffice.bsky.social
What does that wage gap look like once housing and other cost differences in London accounted for? Cf. price index differences between regions (old source but illustrates regional diffs, not inc. housing I don't think). www.ons.gov.uk/economy/infl...

January 22, 2025 at 9:07 AM
What does that wage gap look like once housing and other cost differences in London accounted for? Cf. price index differences between regions (old source but illustrates regional diffs, not inc. housing I don't think). www.ons.gov.uk/economy/infl...
South Yorkshire's Real Yorkshire Pudding Company (~200 employees) has a marvelous pudding map, so you can check your nearest location and filter down by all types of pudding. With puddings for map markers. Niiiice. Tho may have said the word "pudding" too many times now. realyorks.co.uk/stockists/

December 3, 2024 at 10:42 AM
South Yorkshire's Real Yorkshire Pudding Company (~200 employees) has a marvelous pudding map, so you can check your nearest location and filter down by all types of pudding. With puddings for map markers. Niiiice. Tho may have said the word "pudding" too many times now. realyorks.co.uk/stockists/
p.s. the UK does have some small scale demog data - Northern Irish Census data also does 100m^2. E.g. this is Belfast Catholic % (interactive map here: bit.ly/nigrid) but Dutch data service allows access to indivs/households - can trace movement over time, do so much more lovely lovely geography!

November 26, 2024 at 10:51 AM
p.s. the UK does have some small scale demog data - Northern Irish Census data also does 100m^2. E.g. this is Belfast Catholic % (interactive map here: bit.ly/nigrid) but Dutch data service allows access to indivs/households - can trace movement over time, do so much more lovely lovely geography!
... & here's the paper from that Rotterdam work. Image is 100m^2 grid of Dutch-equivalent-of-country-of-birth. Red lines are 'social frontiers' (sharp differences in composition of adjacent communities). Paper examines frontiers' affects on household movements. journals.sagepub.com/doi/full/10....

November 26, 2024 at 10:46 AM
... & here's the paper from that Rotterdam work. Image is 100m^2 grid of Dutch-equivalent-of-country-of-birth. Red lines are 'social frontiers' (sharp differences in composition of adjacent communities). Paper examines frontiers' affects on household movements. journals.sagepub.com/doi/full/10....