@datawithbliss.bsky.social
300 followers 35 following 23 posts
Posts Media Videos Starter Packs
datawithbliss.bsky.social
New dynamic kickoff -- where have teams kicked the ball thru week 4?
datawithbliss.bsky.social
Luck dashboard thru wk 4.

Most impactful plays:
- GB made FG at end of Q4 to tie (-22% for DAL)
- SEA made FG at end of Q4 to win (-18% for ARI)
- ARI dropped pass to interception in Q2 (+17% for SEA)
datawithbliss.bsky.social
Thanks to NextGenStats and @awscloud.bsky.social for the partnership, @kaggle.com for hosting, and to all of our loyal participants for ensuring that our competition is changing the game

#BigDataBowl
datawithbliss.bsky.social
The analytics competition will allow folks to creatively identify characteristics or visualizations of player movement, either on the offensive or defensive sides of the ball

www.kaggle.com/c/nfl-big-da...
NFL Big Data Bowl 2026 - Analytics
Understand player movement while the ball is in the air
www.kaggle.com
datawithbliss.bsky.social
The 2026 Big Data Bowl #BigDataBowl is live!

Participants can sign up for two competitions:
- leaderboard
- traditional analytics competition

This year's task: predict/understand player movement when the ball is in the air
Reposted
kaggle.com
🏈 The 8th annual NFL Big Data Bowl is here!

This year, we’re excited to launch two competitions in collaboration with NFL. Participants will use NFL player tracking (Next Gen Stats) to generate insights that enhance the game.

Pro tip: you can compete in both 😎
More info 👇
datawithbliss.bsky.social
2025 Luck dashboard thru wk 3.

Most impactful plays:
- W1: PIT 60-yd FG in Q4 (-57% for NYJ)
- W2: DAL 64-yd FG in Q4 (-43% for NYG)
- W1: CLE dropped pass to int in Q4 (+43% for CIN)
- W1: DAL dropped pass in Q4 (+40% for PHI)
- W2: KC dropped pass to int in Q4 (+34% for PHI)
datawithbliss.bsky.social
Here is how non-Power conferences would look if they were created purely to minimize the average distance between teams (17 teams per conf).

Avg distance between teams in same conference:
- Current: 625 miles
- Optimal: 516 miles
datawithbliss.bsky.social
When trailing by one score on the last play of a game, offenses face a choice: attempt a Hail Mary (deep pass to the end zone) or a Hook & Ladder (lateralling between teammates moving towards end zone).

Here's how often teams chose each strategy since 2018, by field position:
datawithbliss.bsky.social
With the college football returning, here is how Power 4 conferences would look if they were created purely to minimize the average distance between teams (17 teams per conf).

Avg distance between teams in same conference:
- Current: 787 miles
- Optimal: 479 miles
datawithbliss.bsky.social
Correlation between preseason and regular season performance in NFL has decreased significantly in the last 5 years.

My friend Michael Mackelvie put together an IG short summarizing this finding:

www.instagram.com/reel/DN0oUFX...
datawithbliss.bsky.social
Note: Distances calculated using haversine formula (great circle distance). Lines on the map represent the shortest path between points on Earth's surface, even if the alternative route around Earth is shorter.
datawithbliss.bsky.social
#USOpen 🎾 weekend! Here's a comparison of observed vs optimal WTA player travel between WTA 1000s & Grand Slams:
- Tournament Schedule route: 4,503 km/2,798 mi average b/w tournaments
- Optimal route: 2,621 km/1,629 mi average b/w tournaments
datawithbliss.bsky.social
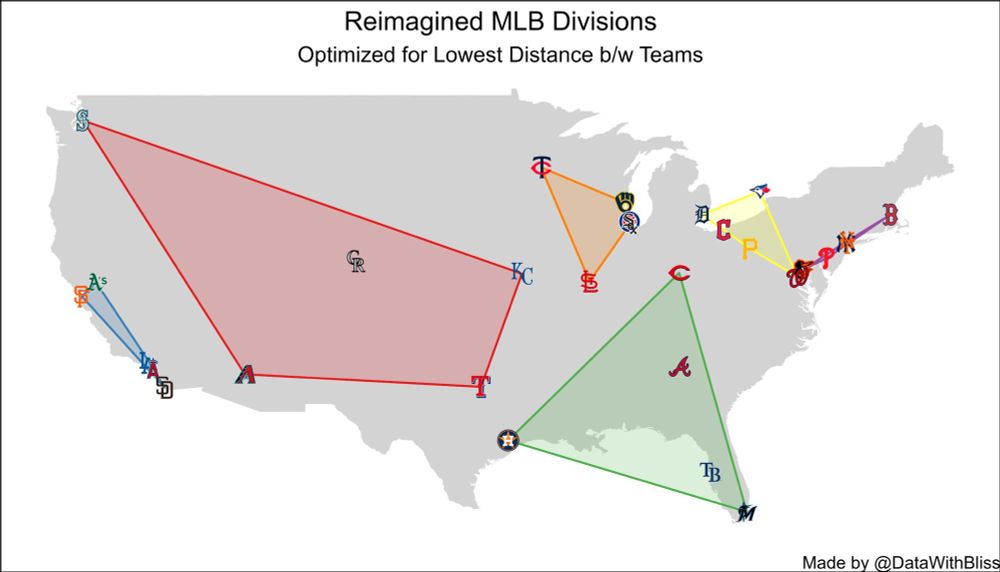
With the NFL season starting in two weeks, here is how NFL conferences would look if they were created purely to minimize the average distance between teams.

Avg distance between teams in same conference:
- Current: 1103 miles
- Optimal: 785 miles
datawithbliss.bsky.social
How has preseason playtime impacted the link between preseason and regular season performance?

From 2000–2017, there was a weak positive correlation (R = 0.24) between preseason and regular season net points per game.

From 2017–2024, that correlation dropped to just 0.05.
datawithbliss.bsky.social
I know you are haha. Yeah between Athletics (when they move to Vegas) and Mariners one of them would be given quite a bit more travel)
datawithbliss.bsky.social
Haha - I do not have a positive/negative opinion of any MLB team!
datawithbliss.bsky.social
Also, regardless of whether the Athletics are in Oakland, Sacramento or Las Vegas, they would be in same reimagined division in this optimization.
datawithbliss.bsky.social
NOTE -- instead of using the full optimization, a simpler problem (assuming teams like SF/Boston cant be in same division) was used instead -- this almost definitely gives same results as full optimization though.
datawithbliss.bsky.social
With the MLB All-Star game tonight, here is how MLB divisions would look if they were created purely to minimize the average distance between teams.

Avg distance between teams in same division:
- Current: 606 miles
- Optimal: 421 miles
datawithbliss.bsky.social
Baker Mayfield boasted the highest EPA/play, Success Rate and Completion % Over Expected for all passers in the 2025 #ProBowlGames .

Gardner Minshew still leads in career EPA/Play & Success Rate from his 2023 appearance.
Reposted
statsbylopez.bsky.social
Congratulations to the Finalists, Semi-Finalists, and Honorable Mention finishers in the 2025 Big Data Bowl #BigDataBowl