easystats
@easystats.github.io
950 followers
120 following
89 posts
Official channel of {easystats}, a collection of #rstats 📦s with a unifying and consistent framework for statistical modeling, visualization, and reporting.
“Statistics are like sausages. It’s better not to see them being made, unless you use easystats.”
Posts
Media
Videos
Starter Packs
easystats
@easystats.github.io
· Sep 1
easystats
@easystats.github.io
· Sep 1


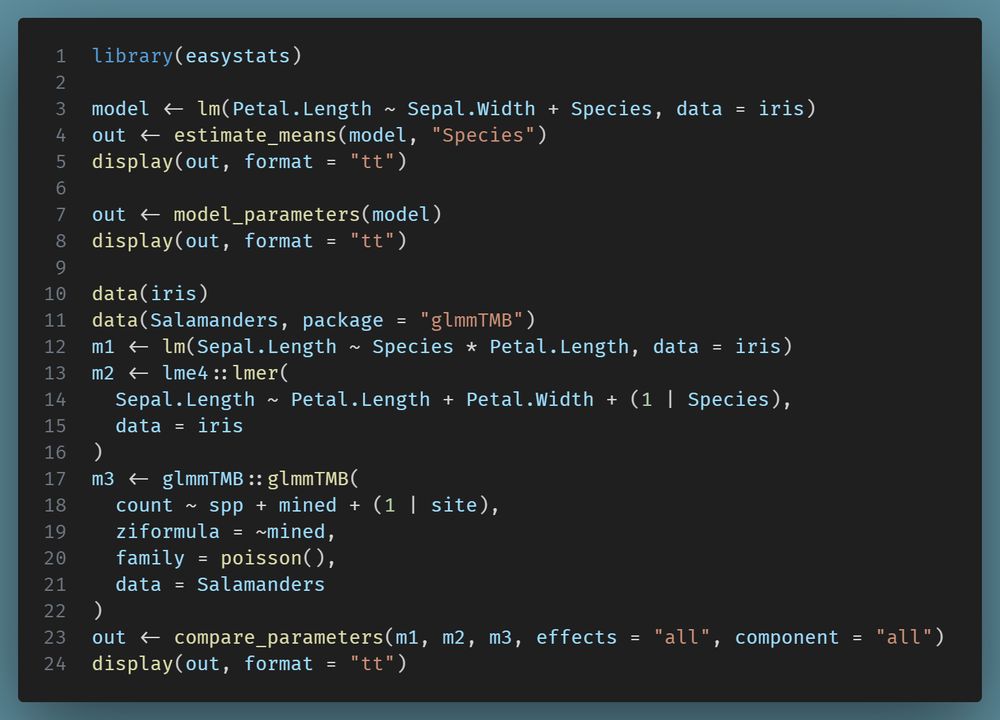
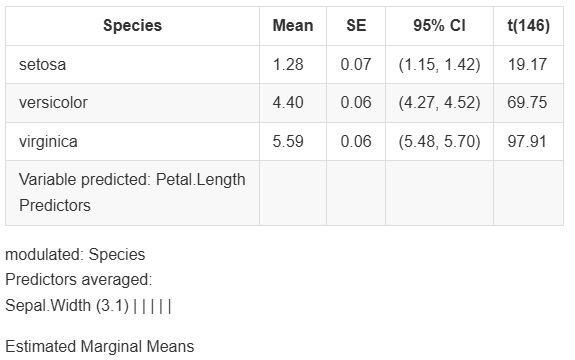
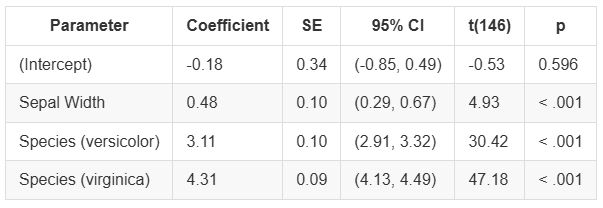
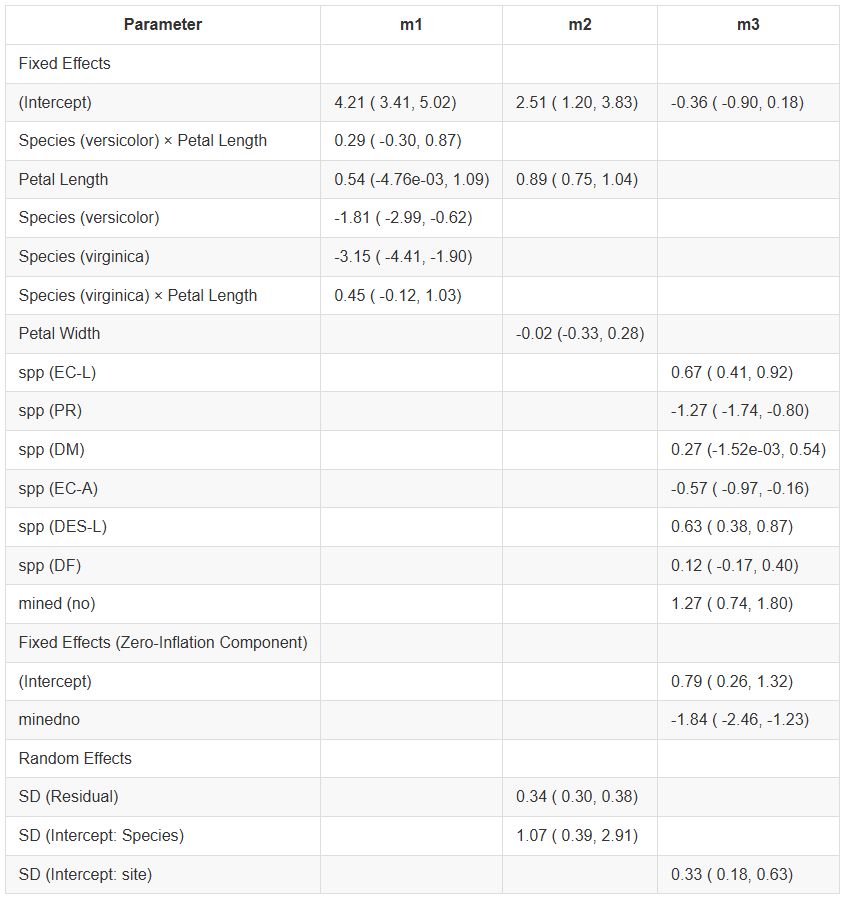
easystats
@easystats.github.io
· Aug 31
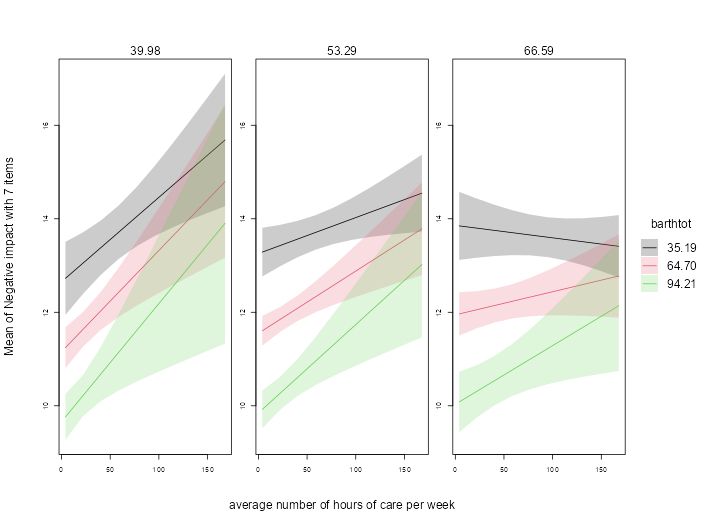
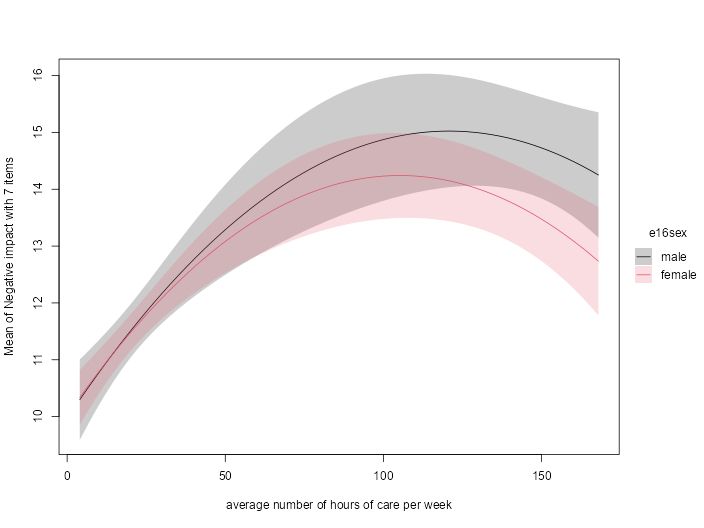
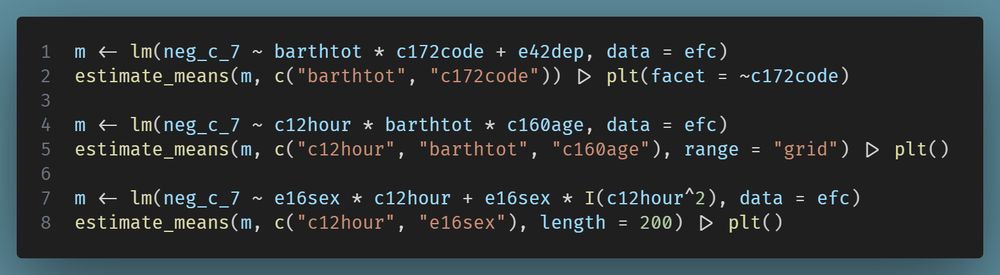
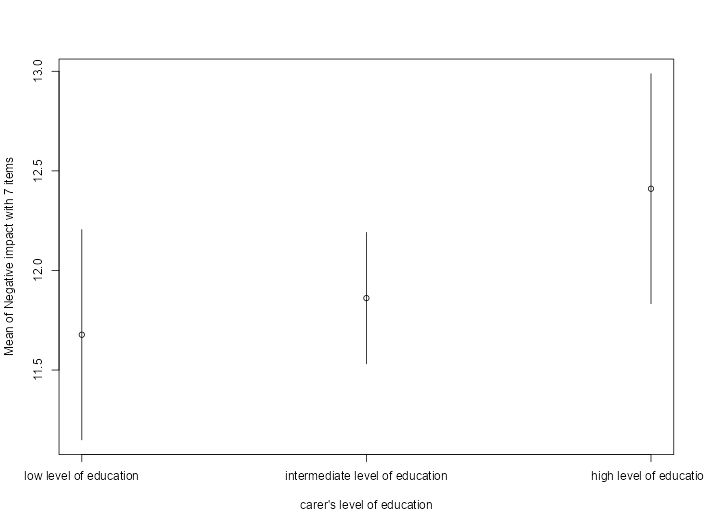
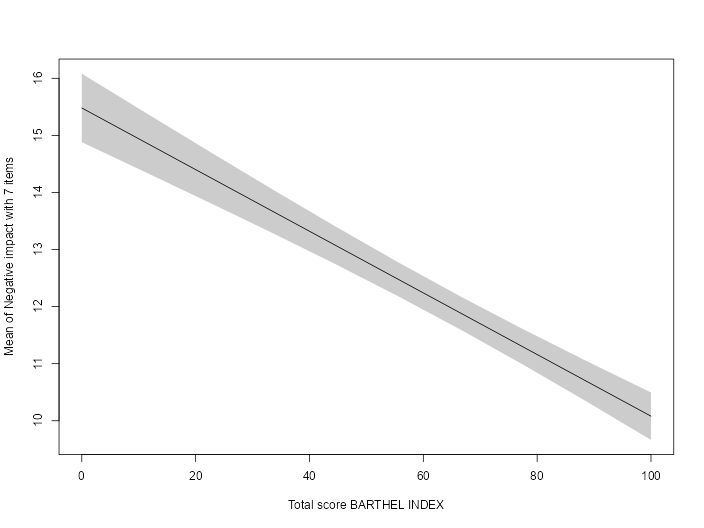
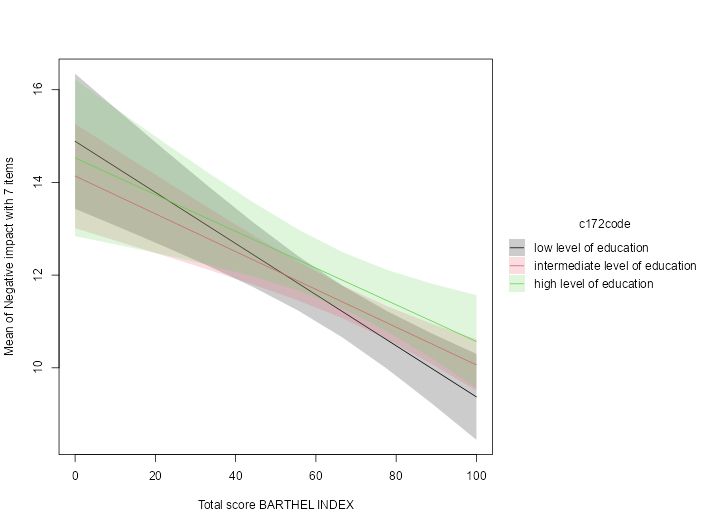
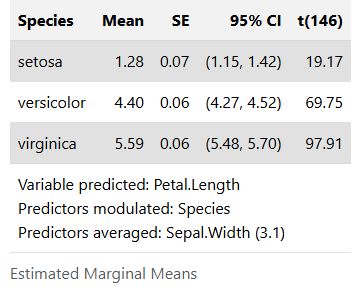
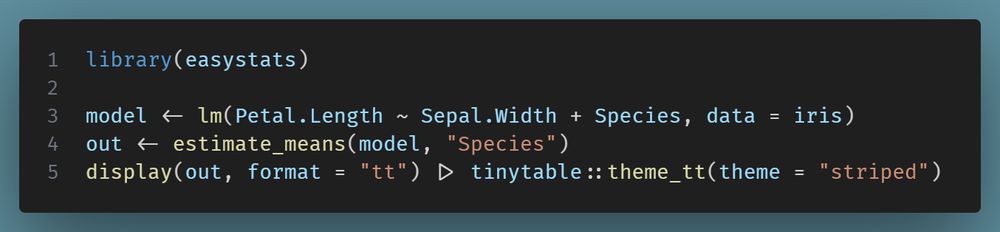
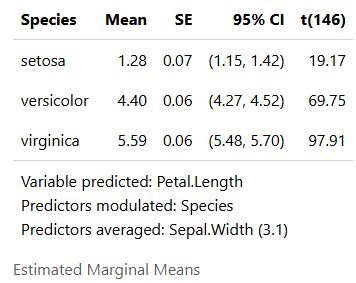
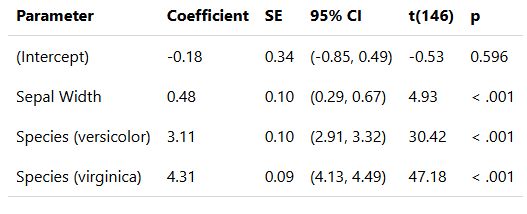
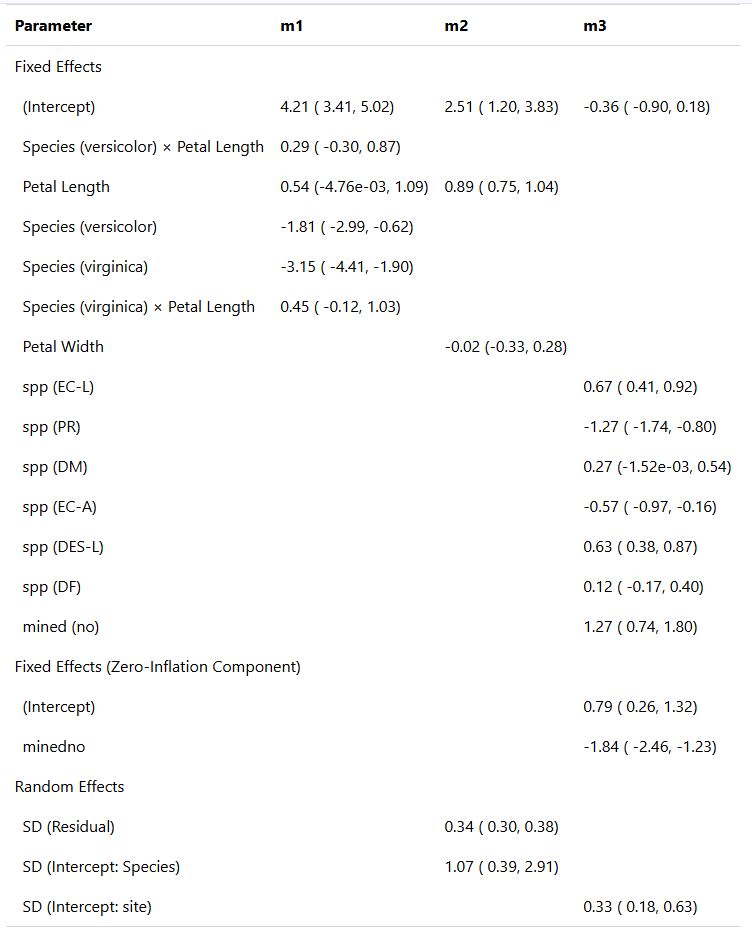
Estimation of Model-Based Predictions, Contrasts and Means
Implements a general interface for model-based estimations for a wide variety of models, used in the computation of marginal means, contrast analysis and predictions. For a list of supported models, s...
easystats.github.io
easystats
@easystats.github.io
· Aug 31

modelbased: An R package to make the most out of your statistical models through marginal means, marginal effects, and model predictions
Makowski et al., (2025). modelbased: An R package to make the most out of your statistical models through marginal means, marginal effects, and model predictions. Journal of Open Source Software, 10(1...
doi.org
easystats
@easystats.github.io
· Aug 31
Reposted by easystats


Reposted by easystats

Reposted by easystats

Reposted by easystats

easystats
@easystats.github.io
· Jul 14