


easystats
@easystats.github.io
Official channel of {easystats}, a collection of #rstats 📦s with a unifying and consistent framework for statistical modeling, visualization, and reporting.
“Statistics are like sausages. It’s better not to see them being made, unless you use easystats.”
“Statistics are like sausages. It’s better not to see them being made, unless you use easystats.”
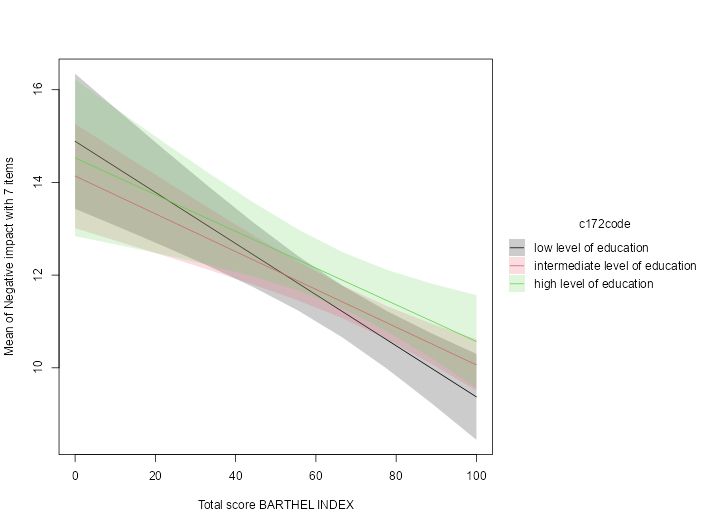
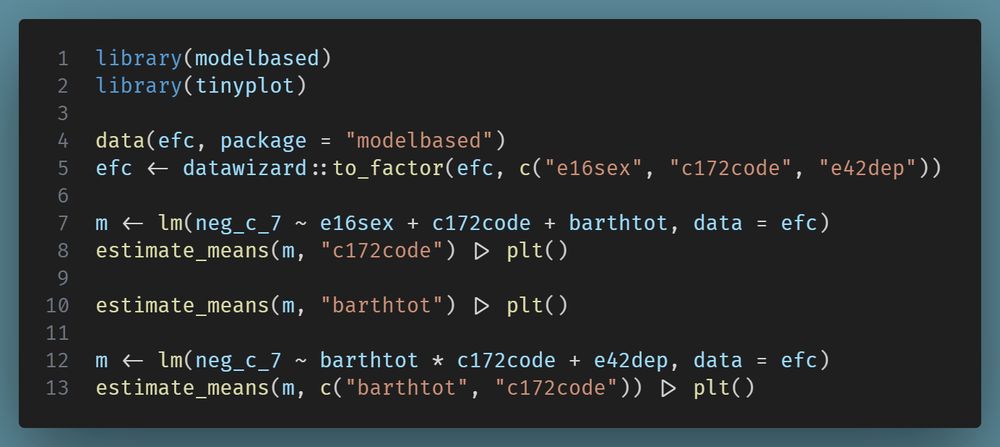
Ah, no, we used `datawizard::to_factor()` to convert label attributes into factor levels.
December 14, 2025 at 4:32 PM
Ah, no, we used `datawizard::to_factor()` to convert label attributes into factor levels.
One advantage of that data is that it has labelled data, and you can see the automatic labelling feature in later plots.
December 14, 2025 at 4:28 PM
One advantage of that data is that it has labelled data, and you can see the automatic labelling feature in later plots.
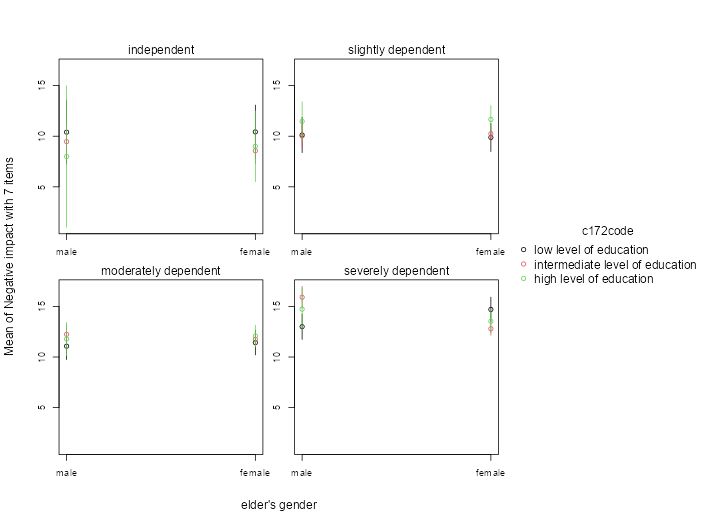
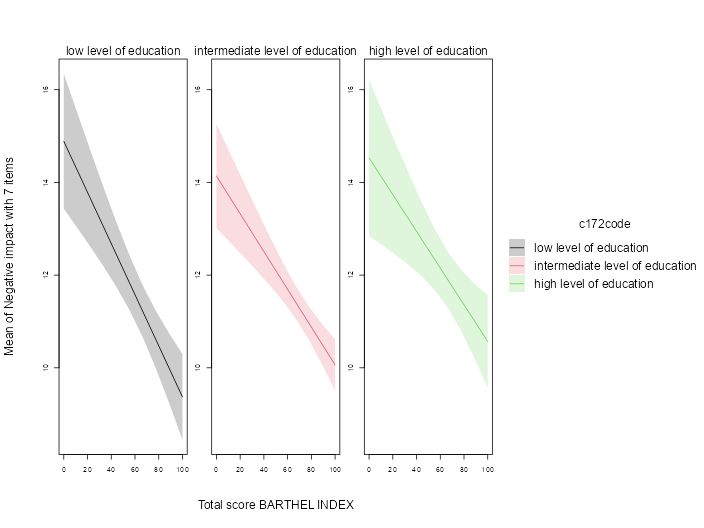
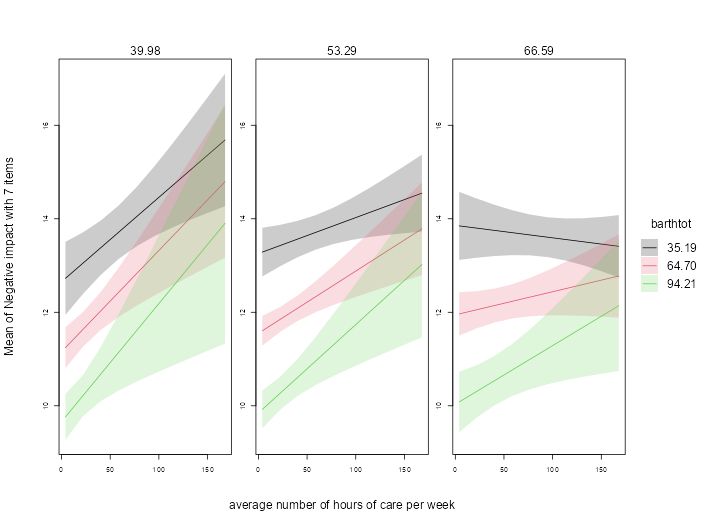
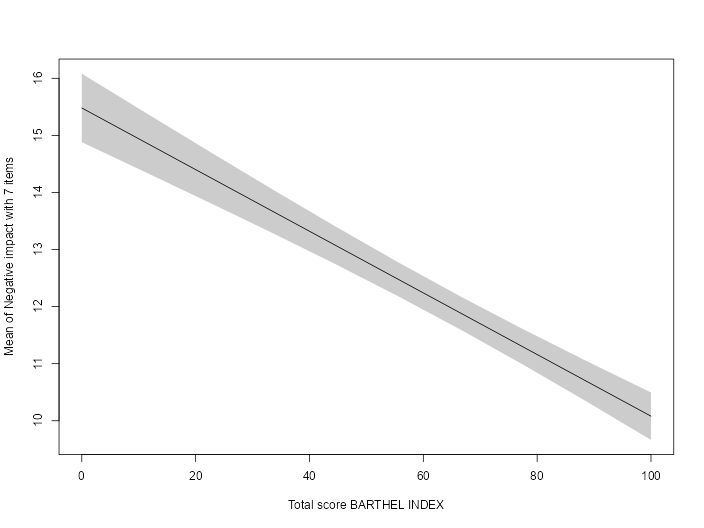
🎉 Great news for #rstats users! If you love the native R graphics feel of #tinyplot AND you're a fan of the powerful #easystats #modelbased package, this is for you!
Thanks to @gmcd.bsky.social, we significantly enhanced the tinyplot integration.
🔗 Read more: easystats.github.io/modelbased/a...
Thanks to @gmcd.bsky.social, we significantly enhanced the tinyplot integration.
🔗 Read more: easystats.github.io/modelbased/a...
Plotting estimated marginal means with tinyplot
easystats.github.io
December 12, 2025 at 7:22 AM
🎉 Great news for #rstats users! If you love the native R graphics feel of #tinyplot AND you're a fan of the powerful #easystats #modelbased package, this is for you!
Thanks to @gmcd.bsky.social, we significantly enhanced the tinyplot integration.
🔗 Read more: easystats.github.io/modelbased/a...
Thanks to @gmcd.bsky.social, we significantly enhanced the tinyplot integration.
🔗 Read more: easystats.github.io/modelbased/a...
Reposted by easystats

{report} #rstats package version 0.6.2 is now on CRAN!
MANY bug fixes in this version! Including corrected duplicated text outputs and dramatic speed increases for brmsfit models (which used to refit the model entirely every time).
easystats.github.io/report/
With the @easystats.github.io team
MANY bug fixes in this version! Including corrected duplicated text outputs and dramatic speed increases for brmsfit models (which used to refit the model entirely every time).
easystats.github.io/report/
With the @easystats.github.io team
Automated Reporting of Results and Statistical Models
The aim of the report package is to bridge the gap between R’s output and the formatted results contained in your manuscript. This package converts statistical models and data frames into textual repo...
easystats.github.io
November 8, 2025 at 11:07 PM
{report} #rstats package version 0.6.2 is now on CRAN!
MANY bug fixes in this version! Including corrected duplicated text outputs and dramatic speed increases for brmsfit models (which used to refit the model entirely every time).
easystats.github.io/report/
With the @easystats.github.io team
MANY bug fixes in this version! Including corrected duplicated text outputs and dramatic speed increases for brmsfit models (which used to refit the model entirely every time).
easystats.github.io/report/
With the @easystats.github.io team
... which you can do by adding additional "layers", if you use the gt-format or tinytable-format.
September 1, 2025 at 2:54 PM
... which you can do by adding additional "layers", if you use the gt-format or tinytable-format.
Not sure about the specific requirements for APA 7 style, but I guess you may need some additionally tweaking of the returned table object.
September 1, 2025 at 2:53 PM
Not sure about the specific requirements for APA 7 style, but I guess you may need some additionally tweaking of the returned table object.
Wanna dive deeper into the table universe? Check out these links:
👉 easystats.github.io/insight/arti...
👉 vincentarelbundock.github.io/tinytable/
Happy printing, everyone! 🖨️ #rstats #easystats
👉 easystats.github.io/insight/arti...
👉 vincentarelbundock.github.io/tinytable/
Happy printing, everyone! 🖨️ #rstats #easystats
Formatting, printing and exporting tables
easystats.github.io
September 1, 2025 at 6:04 AM
Wanna dive deeper into the table universe? Check out these links:
👉 easystats.github.io/insight/arti...
👉 vincentarelbundock.github.io/tinytable/
Happy printing, everyone! 🖨️ #rstats #easystats
👉 easystats.github.io/insight/arti...
👉 vincentarelbundock.github.io/tinytable/
Happy printing, everyone! 🖨️ #rstats #easystats
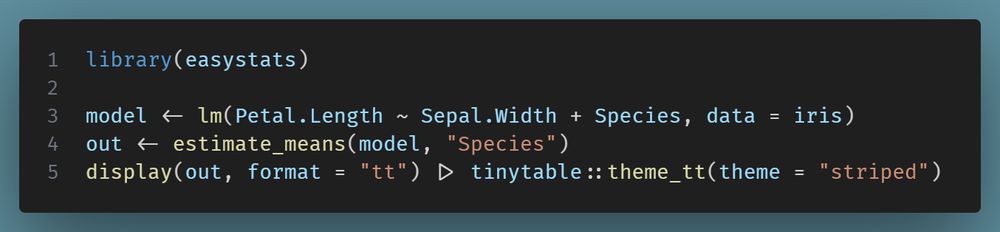
That "tt" option is now fully rolled out across several #easystats packages, powered by the amazing {tinytable} package. This means you can create tables in a gazillion different output formats! How cool is that? 🤯

September 1, 2025 at 6:04 AM
That "tt" option is now fully rolled out across several #easystats packages, powered by the amazing {tinytable} package. This means you can create tables in a gazillion different output formats! How cool is that? 🤯
And you can totally control the vibe! Use the `format` argument to get "markdown" (for a classic kable look), "html" (for a sleek gt-table), or the new kid on the block, "tt" (for a tinytable masterpiece!).

September 1, 2025 at 6:04 AM
And you can totally control the vibe! Use the `format` argument to get "markdown" (for a classic kable look), "html" (for a sleek gt-table), or the new kid on the block, "tt" (for a tinytable masterpiece!).
... and when they print, it's thanks to some behind-the-scenes magic with `insight::format_table()` and `insight::export_table()`! ✨
But there's more! Many #easystats functions also have a `display()` method. Think of it as your personal table stylist, making everything look super user-friendly! 💅
But there's more! Many #easystats functions also have a `display()` method. Think of it as your personal table stylist, making everything look super user-friendly! 💅

September 1, 2025 at 6:04 AM
... and when they print, it's thanks to some behind-the-scenes magic with `insight::format_table()` and `insight::export_table()`! ✨
But there's more! Many #easystats functions also have a `display()` method. Think of it as your personal table stylist, making everything look super user-friendly! 💅
But there's more! Many #easystats functions also have a `display()` method. Think of it as your personal table stylist, making everything look super user-friendly! 💅
Alrighty, {easystats} users! 👋 Ever wonder how those neat tables magically appear in your R console, or even better, in your fancy #rstats Markdown and Quarto docs?
Well, most of the objects you work with in {easystats} are basically tables, i.e. a 2D matrix with columns and rows...
Well, most of the objects you work with in {easystats} are basically tables, i.e. a 2D matrix with columns and rows...

September 1, 2025 at 6:04 AM
Alrighty, {easystats} users! 👋 Ever wonder how those neat tables magically appear in your R console, or even better, in your fancy #rstats Markdown and Quarto docs?
Well, most of the objects you work with in {easystats} are basically tables, i.e. a 2D matrix with columns and rows...
Well, most of the objects you work with in {easystats} are basically tables, i.e. a 2D matrix with columns and rows...
Even if you're not tackling these super complex questions, {modelbased} is generally just a fantastic tool for really getting your head around your statistical models. Go on, take a peek! You might just fall in love: easystats.github.io/modelbased/
#rstats #easystats #marginaleffects #inference
#rstats #easystats #marginaleffects #inference
Estimation of Model-Based Predictions, Contrasts and Means
Implements a general interface for model-based estimations for a wide variety of models, used in the computation of marginal means, contrast analysis and predictions. For a list of supported models, s...
easystats.github.io
August 31, 2025 at 8:27 AM
Even if you're not tackling these super complex questions, {modelbased} is generally just a fantastic tool for really getting your head around your statistical models. Go on, take a peek! You might just fall in love: easystats.github.io/modelbased/
#rstats #easystats #marginaleffects #inference
#rstats #easystats #marginaleffects #inference
Dealing with interrupted time series where a sudden event just messed with everything?
easystats.github.io/modelbased/a...
Curious about disparities, different trajectories of hidden groups, and what makes them tick?
easystats.github.io/modelbased/a...
easystats.github.io/modelbased/a...
Curious about disparities, different trajectories of hidden groups, and what makes them tick?
easystats.github.io/modelbased/a...
Interrupted Time Series Analysis
easystats.github.io
August 31, 2025 at 8:27 AM
Dealing with interrupted time series where a sudden event just messed with everything?
easystats.github.io/modelbased/a...
Curious about disparities, different trajectories of hidden groups, and what makes them tick?
easystats.github.io/modelbased/a...
easystats.github.io/modelbased/a...
Curious about disparities, different trajectories of hidden groups, and what makes them tick?
easystats.github.io/modelbased/a...
Got a thing for social and health inequalities?
easystats.github.io/modelbased/a...
Or maybe you're into the nitty-gritty of intersectional analysis?
easystats.github.io/modelbased/a...
easystats.github.io/modelbased/a...
Or maybe you're into the nitty-gritty of intersectional analysis?
easystats.github.io/modelbased/a...
Case Study: Measuring and comparing absolute and relative inequalities in R
easystats.github.io
August 31, 2025 at 8:27 AM
Got a thing for social and health inequalities?
easystats.github.io/modelbased/a...
Or maybe you're into the nitty-gritty of intersectional analysis?
easystats.github.io/modelbased/a...
easystats.github.io/modelbased/a...
Or maybe you're into the nitty-gritty of intersectional analysis?
easystats.github.io/modelbased/a...
True to the #easystats vibe, {modelbased} keeps things simple, flexible, and easy-peasy so you can truly unleash the power of your models without pulling your hair out.
Ever wondered about cause and effect in observational data without needing a time machine?
easystats.github.io/modelbased/a...
Ever wondered about cause and effect in observational data without needing a time machine?
easystats.github.io/modelbased/a...
Case Study: Causal inference for observational data using modelbased
easystats.github.io
August 31, 2025 at 8:27 AM
True to the #easystats vibe, {modelbased} keeps things simple, flexible, and easy-peasy so you can truly unleash the power of your models without pulling your hair out.
Ever wondered about cause and effect in observational data without needing a time machine?
easystats.github.io/modelbased/a...
Ever wondered about cause and effect in observational data without needing a time machine?
easystats.github.io/modelbased/a...
The {modelbased} R package is here to be your statistical sidekick! It's an #rstats gem that helps you squeeze every last drop of insight from your models. It's got a super user-friendly interface to pull out all those estimands from a huge variety of models (doi.org/10.21105/jos...).

modelbased: An R package to make the most out of your statistical models through marginal means, marginal effects, and model predictions
Makowski et al., (2025). modelbased: An R package to make the most out of your statistical models through marginal means, marginal effects, and model predictions. Journal of Open Source Software, 10(1...
doi.org
August 31, 2025 at 8:27 AM
The {modelbased} R package is here to be your statistical sidekick! It's an #rstats gem that helps you squeeze every last drop of insight from your models. It's got a super user-friendly interface to pull out all those estimands from a huge variety of models (doi.org/10.21105/jos...).
Okay, so you've crunched your numbers and got some awesome statistical models? Sometimes, just knowing "X predicts Y" isn't enough to really get to the juicy bits. That's where the cool post-hoc stuff comes in – think estimated marginal means, contrasts, pairwise comparisons, or #marginaleffects.
August 31, 2025 at 8:27 AM
Okay, so you've crunched your numbers and got some awesome statistical models? Sometimes, just knowing "X predicts Y" isn't enough to really get to the juicy bits. That's where the cool post-hoc stuff comes in – think estimated marginal means, contrasts, pairwise comparisons, or #marginaleffects.
Reposted by easystats

I’m about halfway through this update (first 11 tutorials are done). I think they’re a lot better. Using a consistent @easystats.github.io workflow throughout will - I think - massively reduce the cognitive load for students. Looking forward to road testing in autumn term.
Probably no-one except me uses my R tutorials in their teaching, but if you do, I'm re-writing them over the next 6-9 months. My goal is to streamline them based on 5 years of using them in class, but if you have (polite) requests/suggestsions let me have them. www.discovr.rocks/discovr/

discovr: a package of interactive tutorials | discovr
Statistics education
www.discovr.rocks
August 20, 2025 at 10:19 PM
I’m about halfway through this update (first 11 tutorials are done). I think they’re a lot better. Using a consistent @easystats.github.io workflow throughout will - I think - massively reduce the cognitive load for students. Looking forward to road testing in autumn term.
How to summarize the total effect of a categorical variable like education? A new vignette shows how to compute absolute and relative inequality with the #easystats {modelbased}📦in #rstats. Get a single, interpretable number to quantify overall group disparities!
easystats.github.io/modelbased/a...
easystats.github.io/modelbased/a...
Case Study: Measuring and comparing absolute and relative inequalities in R
easystats.github.io
July 28, 2025 at 7:13 AM
How to summarize the total effect of a categorical variable like education? A new vignette shows how to compute absolute and relative inequality with the #easystats {modelbased}📦in #rstats. Get a single, interpretable number to quantify overall group disparities!
easystats.github.io/modelbased/a...
easystats.github.io/modelbased/a...
Reposted by easystats

Modelbased for Quick and Beautiful Model Visualization in #rstats imachordata.com/2025/07/25/m... Thanks, @easystats.github.io!
Modelbased for Quick and Beautiful Model Visualization · I'm a Chordata! Urochordata!
imachordata.com
July 25, 2025 at 8:38 PM
Modelbased for Quick and Beautiful Model Visualization in #rstats imachordata.com/2025/07/25/m... Thanks, @easystats.github.io!
Just dodging is not yet implemented in {tinyplot}, but hopefully coming soon!
July 22, 2025 at 3:27 PM
Just dodging is not yet implemented in {tinyplot}, but hopefully coming soon!
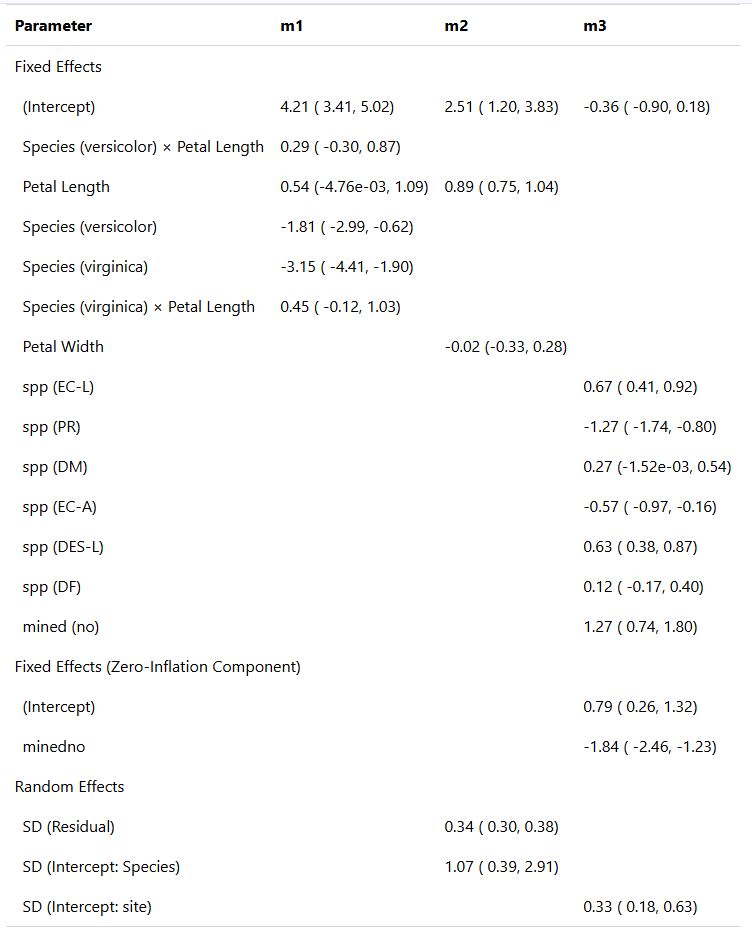
As you can see, many plot types already work, just some fine-tuning left to do...
July 22, 2025 at 3:27 PM
As you can see, many plot types already work, just some fine-tuning left to do...
🎉 Great news, R users! 🎉 We're thrilled to announce that {tinyplot} support is coming to the #rstats #easystats project! Get ready for even more amazing stuff to make your data analysis a breeze! 📊✨
@gmcd.bsky.social @vincentab.bsky.social @zeileis.org
@gmcd.bsky.social @vincentab.bsky.social @zeileis.org
July 22, 2025 at 3:27 PM
🎉 Great news, R users! 🎉 We're thrilled to announce that {tinyplot} support is coming to the #rstats #easystats project! Get ready for even more amazing stuff to make your data analysis a breeze! 📊✨
@gmcd.bsky.social @vincentab.bsky.social @zeileis.org
@gmcd.bsky.social @vincentab.bsky.social @zeileis.org
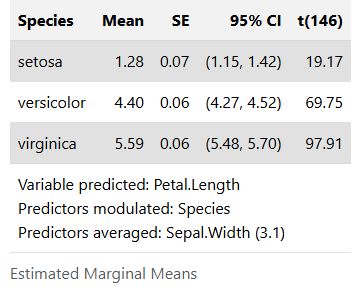
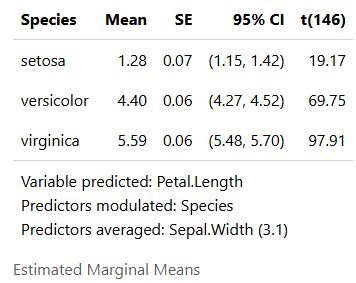
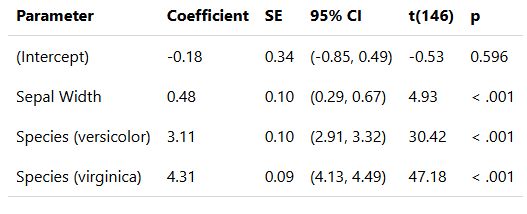
Since `display(format = "tt")` returns a `tinytable` object, you can easily modify the table to meet your needs.
July 22, 2025 at 7:47 AM
Since `display(format = "tt")` returns a `tinytable` object, you can easily modify the table to meet your needs.
Here's the default HTML rendering.
July 22, 2025 at 7:45 AM
Here's the default HTML rendering.