Enrique M. Muro
@emmuro.bsky.social
7 followers 6 following 1 posts
Computational biologist at the Johannes Gutenberg University in Mainz, Germany https://cbdm-01.zdv.uni-mainz.de/~muro/ https://github.com/emuro
Posts Media Videos Starter Packs
Reposted by Enrique M. Muro
pnas.org
One of the most-viewed PNAS articles in the last week is “The emergence of eukaryotes as an evolutionary algorithmic phase transition.” Explore the article here: www.pnas.org/doi/10.1073/...

For more trending articles, visit ow.ly/Me2U50SkLRZ.
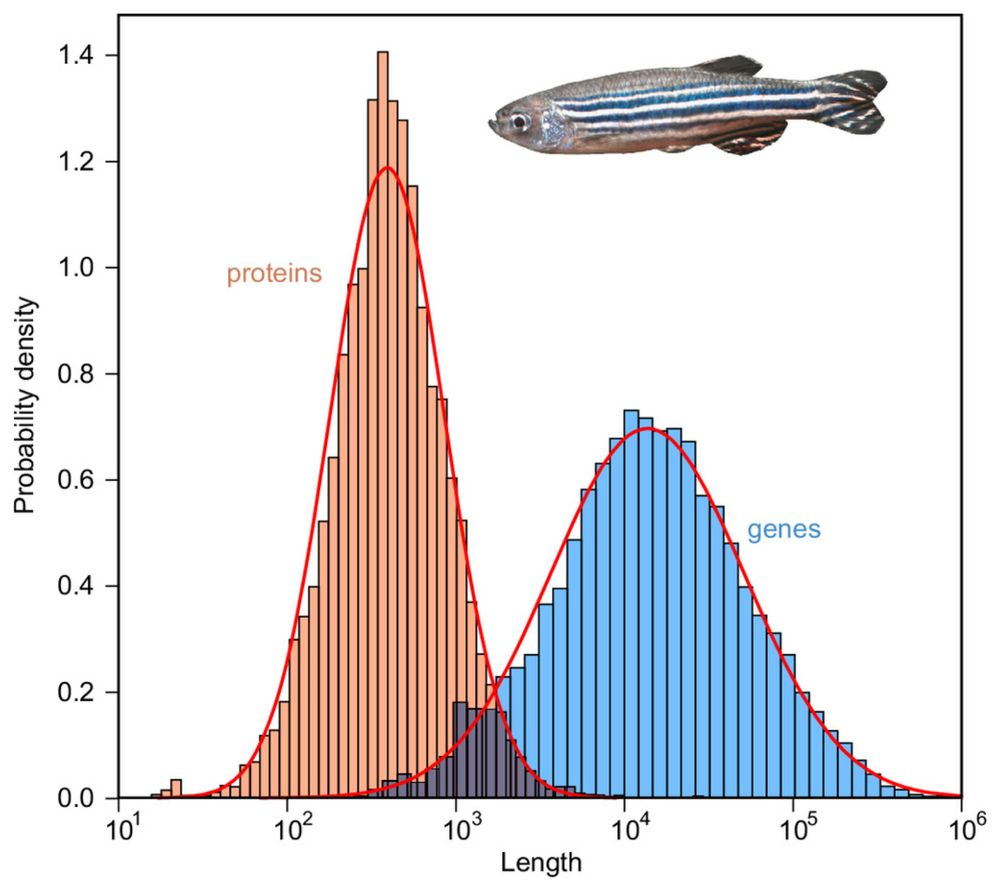
Gene and protein length distributions are lognormal. Length distributions for genes (blue, measured in number of base pairs) and their corresponding proteins (orange, measured in number of amino acids) for Danio rerio (zebrafish). Note that lengths are represented on a logarithmic scale. The red curves are fits to lognormal distributions.
Reposted by Enrique M. Muro
mainzuniversity.bsky.social
#EukaryoticCells emerged as evolutionary algorithmic phase transition / #Eukaryogenesis happened abruptly, led by tension of increasing gene length and constraints on producing longer #proteins 👉 press.uni-mainz.de/eukaryotic-c...

#EvolutionaryBiology #ComputerBiology #eukaryotic #genes #evolution
The image shows the evolution of protein-coding gene length distributions across evolutionary time (ill./©: Fernando J. Ballesteros)
Reposted by Enrique M. Muro
unimainz.bsky.social
Entstehung komplexen Lebens: Wissenschaftler haben herausgefunden, warum #Eukaryoten entstanden sind / Entwicklung der eukaryotischen Zelle stellt größte Komplexitätssteigerung in der Geschichte des Lebens auf der Erde dar 👉 presse.uni-mainz.de/die-entstehu...

#Evolutionsbiologie #Computerbiologie
Die Grafik zeigt die Entwicklung der Längenverteilung proteincodierender Gene im Laufe der Evolution. (Abb./©: Fernando J. Ballesteros)
emmuro.bsky.social
Our new study on the emergence of the eukaryotic cell as an evolutionary algorithmic phase transition. The transition was continuous yet abrupt...

www.pnas.org/doi/10.1073/...

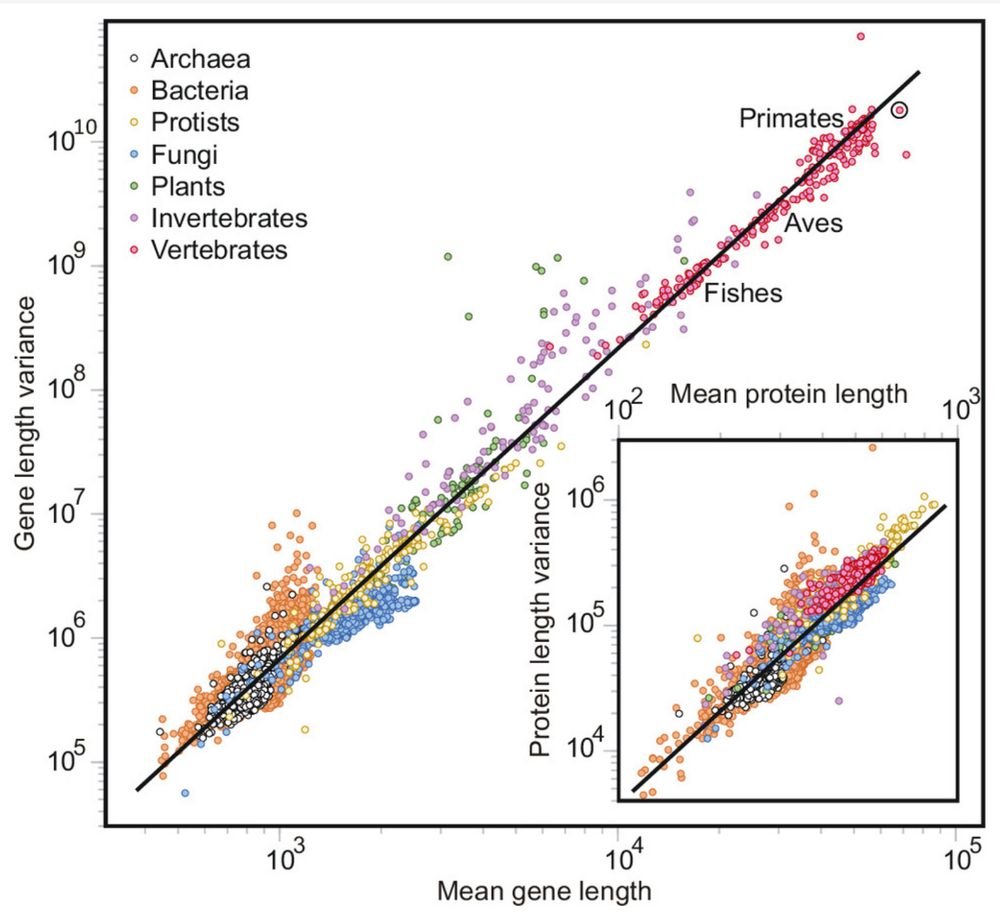
See more results, such as the next scaling law in the entire tree of life:
Gene and protein length distributions are lognormal. Scale-invariant relationship between mean gene length and variance. Each dot in this log–log plot represents the genome of a single species (33,627), with H. sapiens highlighted by the circle. Different colors identify major phyletic groups.