


Eric Balash
@ericbalash.bsky.social
Tableau Visionary & 5x Tableau Public Ambassador | Data Viz at NFCU #VizOfTheDay x4 | The Tableau Student Guide & Back 2 Viz Basics Lead #B2VB
🚨Week 22 of Back 2 Viz Basics is live!
Challenge: Design for Accessibility
We are kicking off a two-week collab with Visual Climate. This week is all about creating an accessible chart or dashboard using climate data.
Challenge details: bit.ly/3XfnSm9
Tag us! #B2VB
Challenge: Design for Accessibility
We are kicking off a two-week collab with Visual Climate. This week is all about creating an accessible chart or dashboard using climate data.
Challenge details: bit.ly/3XfnSm9
Tag us! #B2VB
data.world
bit.ly
November 3, 2025 at 4:51 PM
🚨Week 22 of Back 2 Viz Basics is live!
Challenge: Design for Accessibility
We are kicking off a two-week collab with Visual Climate. This week is all about creating an accessible chart or dashboard using climate data.
Challenge details: bit.ly/3XfnSm9
Tag us! #B2VB
Challenge: Design for Accessibility
We are kicking off a two-week collab with Visual Climate. This week is all about creating an accessible chart or dashboard using climate data.
Challenge details: bit.ly/3XfnSm9
Tag us! #B2VB
💡Started a new blog series called Dashboard Design Lab, sharing what our team is learning each week about building better dashboards in #Tableau and #PowerBI.
Week 1: Designing to a Grid.
📬 Substack: tinyurl.com/4h7n2p6a
✏️ Medium: tinyurl.com/ymp45krm
Week 1: Designing to a Grid.
📬 Substack: tinyurl.com/4h7n2p6a
✏️ Medium: tinyurl.com/ymp45krm

October 22, 2025 at 1:43 PM
💡Started a new blog series called Dashboard Design Lab, sharing what our team is learning each week about building better dashboards in #Tableau and #PowerBI.
Week 1: Designing to a Grid.
📬 Substack: tinyurl.com/4h7n2p6a
✏️ Medium: tinyurl.com/ymp45krm
Week 1: Designing to a Grid.
📬 Substack: tinyurl.com/4h7n2p6a
✏️ Medium: tinyurl.com/ymp45krm
🚨Week 21 of Back 2 Viz Basics is live!
Challenge: Use a Date Calculation
Data: US Government shutdowns since 1976
Link: bit.ly/4qo7pK4
Share, Submit, and Tag us!
#B2VB #Tableau #DataVisualization #GovernmentData
Challenge: Use a Date Calculation
Data: US Government shutdowns since 1976
Link: bit.ly/4qo7pK4
Share, Submit, and Tag us!
#B2VB #Tableau #DataVisualization #GovernmentData
data.world
bit.ly
October 19, 2025 at 4:45 PM
🚨Week 21 of Back 2 Viz Basics is live!
Challenge: Use a Date Calculation
Data: US Government shutdowns since 1976
Link: bit.ly/4qo7pK4
Share, Submit, and Tag us!
#B2VB #Tableau #DataVisualization #GovernmentData
Challenge: Use a Date Calculation
Data: US Government shutdowns since 1976
Link: bit.ly/4qo7pK4
Share, Submit, and Tag us!
#B2VB #Tableau #DataVisualization #GovernmentData
🚨Week 20 of Back 2 Viz Basics is here!
🔹Challenge: Build a Heat Map
🔹Dataset: @Ipsos Health Service Report 2024: showing how concern for mental health varies across 31 countries.
🔹Link to Prompt: bit.ly/46SEFQF
Don't forget to tag us! #B2VB #Tableau #DataChallenge
🔹Challenge: Build a Heat Map
🔹Dataset: @Ipsos Health Service Report 2024: showing how concern for mental health varies across 31 countries.
🔹Link to Prompt: bit.ly/46SEFQF
Don't forget to tag us! #B2VB #Tableau #DataChallenge
data.world
bit.ly
October 6, 2025 at 2:29 PM
🚨Week 20 of Back 2 Viz Basics is here!
🔹Challenge: Build a Heat Map
🔹Dataset: @Ipsos Health Service Report 2024: showing how concern for mental health varies across 31 countries.
🔹Link to Prompt: bit.ly/46SEFQF
Don't forget to tag us! #B2VB #Tableau #DataChallenge
🔹Challenge: Build a Heat Map
🔹Dataset: @Ipsos Health Service Report 2024: showing how concern for mental health varies across 31 countries.
🔹Link to Prompt: bit.ly/46SEFQF
Don't forget to tag us! #B2VB #Tableau #DataChallenge
Week 19 of Back 2 Viz Basics is here!
Challenge: Build a Unit Chart
Dataset: Most downloaded Google apps in 2025.
Show how apps compare using units instead of bars.
Challenge: bit.ly/4mvjUAf
#B2VB #Tableau #DataChallenge
Challenge: Build a Unit Chart
Dataset: Most downloaded Google apps in 2025.
Show how apps compare using units instead of bars.
Challenge: bit.ly/4mvjUAf
#B2VB #Tableau #DataChallenge
data.world
bit.ly
September 22, 2025 at 3:41 PM
Week 19 of Back 2 Viz Basics is here!
Challenge: Build a Unit Chart
Dataset: Most downloaded Google apps in 2025.
Show how apps compare using units instead of bars.
Challenge: bit.ly/4mvjUAf
#B2VB #Tableau #DataChallenge
Challenge: Build a Unit Chart
Dataset: Most downloaded Google apps in 2025.
Show how apps compare using units instead of bars.
Challenge: bit.ly/4mvjUAf
#B2VB #Tableau #DataChallenge
🚨 Week 18 of Back 2 Viz Basics is live!
Challenge: Design a Wireframe
Collab with Real World Fake Data:
#B2VB = wireframe
#RWFD = dashboard
Dataset: Call Center Performance with call records, agents, CSAT, and sentiment.
Challenge: bit.ly/46skdH6
Share, submit, and tag us!
Challenge: Design a Wireframe
Collab with Real World Fake Data:
#B2VB = wireframe
#RWFD = dashboard
Dataset: Call Center Performance with call records, agents, CSAT, and sentiment.
Challenge: bit.ly/46skdH6
Share, submit, and tag us!
data.world
bit.ly
September 8, 2025 at 2:14 PM
🚨 Week 18 of Back 2 Viz Basics is live!
Challenge: Design a Wireframe
Collab with Real World Fake Data:
#B2VB = wireframe
#RWFD = dashboard
Dataset: Call Center Performance with call records, agents, CSAT, and sentiment.
Challenge: bit.ly/46skdH6
Share, submit, and tag us!
Challenge: Design a Wireframe
Collab with Real World Fake Data:
#B2VB = wireframe
#RWFD = dashboard
Dataset: Call Center Performance with call records, agents, CSAT, and sentiment.
Challenge: bit.ly/46skdH6
Share, submit, and tag us!
🚨Week 17 of Back 2 Viz Basics is Live!
This week’s topic: Design some KPIs.
We’re using data from the UK Gov’s Wine Cellar (yes, they have one). The dataset tracks stock, usage, costs, and revenues from 2022 to 2024. #B2VB
Challenge: bit.ly/4mxoS0h Share & Tag us!
This week’s topic: Design some KPIs.
We’re using data from the UK Gov’s Wine Cellar (yes, they have one). The dataset tracks stock, usage, costs, and revenues from 2022 to 2024. #B2VB
Challenge: bit.ly/4mxoS0h Share & Tag us!
data.world
bit.ly
August 25, 2025 at 11:50 AM
🚨Week 17 of Back 2 Viz Basics is Live!
This week’s topic: Design some KPIs.
We’re using data from the UK Gov’s Wine Cellar (yes, they have one). The dataset tracks stock, usage, costs, and revenues from 2022 to 2024. #B2VB
Challenge: bit.ly/4mxoS0h Share & Tag us!
This week’s topic: Design some KPIs.
We’re using data from the UK Gov’s Wine Cellar (yes, they have one). The dataset tracks stock, usage, costs, and revenues from 2022 to 2024. #B2VB
Challenge: bit.ly/4mxoS0h Share & Tag us!
🚨 Week 16 of Back 2 Viz Basics is live!
This week’s challenge: Build a Likert Scale Chart
We’re using YouGov survey data on how Americans feel about summertime activities. #B2VB
🔗Challenge: bit.ly/4fGmLEM
Share and Tag us!
This week’s challenge: Build a Likert Scale Chart
We’re using YouGov survey data on how Americans feel about summertime activities. #B2VB
🔗Challenge: bit.ly/4fGmLEM
Share and Tag us!
data.world
bit.ly
August 12, 2025 at 1:49 AM
🚨 Week 16 of Back 2 Viz Basics is live!
This week’s challenge: Build a Likert Scale Chart
We’re using YouGov survey data on how Americans feel about summertime activities. #B2VB
🔗Challenge: bit.ly/4fGmLEM
Share and Tag us!
This week’s challenge: Build a Likert Scale Chart
We’re using YouGov survey data on how Americans feel about summertime activities. #B2VB
🔗Challenge: bit.ly/4fGmLEM
Share and Tag us!
🚨 Week 15 of Back 2 Viz Basics is live! This week’s challenge: Use a parameter. We’re using EV sales data from 2010 to 2024.
Challenge: bit.ly/4o4rMKV
Share and Tag us! #B2VB #Tableau
Challenge: bit.ly/4o4rMKV
Share and Tag us! #B2VB #Tableau
data.world
bit.ly
July 28, 2025 at 4:08 PM
🚨 Week 15 of Back 2 Viz Basics is live! This week’s challenge: Use a parameter. We’re using EV sales data from 2010 to 2024.
Challenge: bit.ly/4o4rMKV
Share and Tag us! #B2VB #Tableau
Challenge: bit.ly/4o4rMKV
Share and Tag us! #B2VB #Tableau
🚨 Week 14 of Back 2 Viz Basics is LIVE! This week’s challenge: Build a Box Plot. We’re using Starbucks matcha data to explore how sugar, calories, caffeine, and more vary across sizes. #B2VB
Prompt: bit.ly/4nImvc1
Share your viz and don't forget to tag us!
Prompt: bit.ly/4nImvc1
Share your viz and don't forget to tag us!
bit.ly
July 14, 2025 at 2:06 PM
🚨 Week 14 of Back 2 Viz Basics is LIVE! This week’s challenge: Build a Box Plot. We’re using Starbucks matcha data to explore how sugar, calories, caffeine, and more vary across sizes. #B2VB
Prompt: bit.ly/4nImvc1
Share your viz and don't forget to tag us!
Prompt: bit.ly/4nImvc1
Share your viz and don't forget to tag us!
🚨 Week 13 of Back 2 Viz Basics is LIVE! This week’s challenge: Use an annotation. We’re working with data on the most expensive sports team sales ever. Highlight a key story or insight with a clear annotation.
Prompt: bit.ly/3G5BT17
Tag us! #B2VB #DataViz #SportsData
Prompt: bit.ly/3G5BT17
Tag us! #B2VB #DataViz #SportsData
bit.ly
June 30, 2025 at 2:57 PM
🚨 Week 13 of Back 2 Viz Basics is LIVE! This week’s challenge: Use an annotation. We’re working with data on the most expensive sports team sales ever. Highlight a key story or insight with a clear annotation.
Prompt: bit.ly/3G5BT17
Tag us! #B2VB #DataViz #SportsData
Prompt: bit.ly/3G5BT17
Tag us! #B2VB #DataViz #SportsData
Spent the last couple weeks traveling through Southern Spain and Casablanca.
Met some awesome people and reconnected with old friends along the way. It was a much-needed reset. Feeling clear-headed, recharged, and ready to get back into the swing of things!
Met some awesome people and reconnected with old friends along the way. It was a much-needed reset. Feeling clear-headed, recharged, and ready to get back into the swing of things!

June 26, 2025 at 8:35 PM
Spent the last couple weeks traveling through Southern Spain and Casablanca.
Met some awesome people and reconnected with old friends along the way. It was a much-needed reset. Feeling clear-headed, recharged, and ready to get back into the swing of things!
Met some awesome people and reconnected with old friends along the way. It was a much-needed reset. Feeling clear-headed, recharged, and ready to get back into the swing of things!
🚨 Week 11 of Back 2 Viz Basics is LIVE! We’re teaming up with the Data Pride TUG to highlight Pride events across the U.S. This week’s challenge: Build a Gantt Chart to show when and where celebrations are happening in June.
Challenge: bit.ly/3T8Ec68
#B2VB #DataPride
Challenge: bit.ly/3T8Ec68
#B2VB #DataPride
bit.ly
June 2, 2025 at 2:55 PM
🚨 Week 11 of Back 2 Viz Basics is LIVE! We’re teaming up with the Data Pride TUG to highlight Pride events across the U.S. This week’s challenge: Build a Gantt Chart to show when and where celebrations are happening in June.
Challenge: bit.ly/3T8Ec68
#B2VB #DataPride
Challenge: bit.ly/3T8Ec68
#B2VB #DataPride
🚨 Week 10 of Back 2 Viz Basics is LIVE!
For #AANHPI Heritage Month, we’re spotlighting data from AAPI Data/AP NORC showing how AANHPI adults prioritize issues like healthcare, housing, and education.
This week’s focus: Percent of Total.
Challenge: bit.ly/4dl93pw
For #AANHPI Heritage Month, we’re spotlighting data from AAPI Data/AP NORC showing how AANHPI adults prioritize issues like healthcare, housing, and education.
This week’s focus: Percent of Total.
Challenge: bit.ly/4dl93pw
bit.ly
May 19, 2025 at 2:31 PM
🚨 Week 10 of Back 2 Viz Basics is LIVE!
For #AANHPI Heritage Month, we’re spotlighting data from AAPI Data/AP NORC showing how AANHPI adults prioritize issues like healthcare, housing, and education.
This week’s focus: Percent of Total.
Challenge: bit.ly/4dl93pw
For #AANHPI Heritage Month, we’re spotlighting data from AAPI Data/AP NORC showing how AANHPI adults prioritize issues like healthcare, housing, and education.
This week’s focus: Percent of Total.
Challenge: bit.ly/4dl93pw
🚨Week 9 of Back 2 Viz Basics is LIVE!
This week we’re using Viz in Tooltip to add insight without clutter. Explore global digital quality of life data and show trends at a glance. #B2VB
Challenge: bit.ly/4jCnEzm
Share and Tag us!!
This week we’re using Viz in Tooltip to add insight without clutter. Explore global digital quality of life data and show trends at a glance. #B2VB
Challenge: bit.ly/4jCnEzm
Share and Tag us!!
bit.ly
May 5, 2025 at 12:17 PM
🚨Week 9 of Back 2 Viz Basics is LIVE!
This week we’re using Viz in Tooltip to add insight without clutter. Explore global digital quality of life data and show trends at a glance. #B2VB
Challenge: bit.ly/4jCnEzm
Share and Tag us!!
This week we’re using Viz in Tooltip to add insight without clutter. Explore global digital quality of life data and show trends at a glance. #B2VB
Challenge: bit.ly/4jCnEzm
Share and Tag us!!
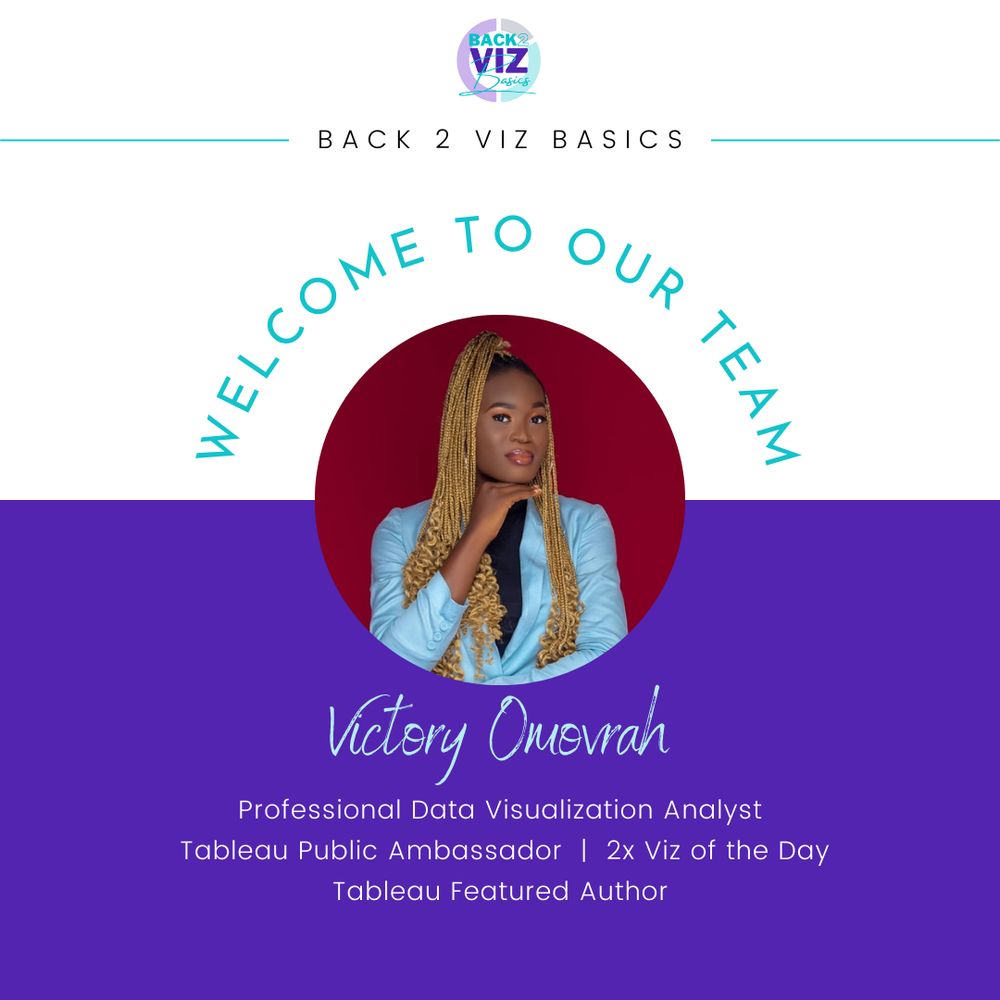
📢Back 2 Viz Basics Team Update: We're thrilled to welcome Victory Omovrah to the Back 2 Viz Basics team!
Victory is a 2024 Tableau Public Ambassador whose impact goes far beyond her incredible dashboards. She’s always uplifting others, sharing community work, and (1/2)
Victory is a 2024 Tableau Public Ambassador whose impact goes far beyond her incredible dashboards. She’s always uplifting others, sharing community work, and (1/2)
April 28, 2025 at 2:52 PM
📢Back 2 Viz Basics Team Update: We're thrilled to welcome Victory Omovrah to the Back 2 Viz Basics team!
Victory is a 2024 Tableau Public Ambassador whose impact goes far beyond her incredible dashboards. She’s always uplifting others, sharing community work, and (1/2)
Victory is a 2024 Tableau Public Ambassador whose impact goes far beyond her incredible dashboards. She’s always uplifting others, sharing community work, and (1/2)
📢 Big news, #DataFam! The Tableau Community is now on Slack and is open to everyone! Connect, learn, and grow with fellow data enthusiasts. I'm especially excited about the back-to-viz-basics channel for sharing work and staying updated on challenges. #Tableau #B2VB #TC25
Join: tabsoft.co/3GslPGe
Join: tabsoft.co/3GslPGe
Tableau Community Slack
https://tabsoft.co/3GslPGe
April 23, 2025 at 6:40 PM
📢 Big news, #DataFam! The Tableau Community is now on Slack and is open to everyone! Connect, learn, and grow with fellow data enthusiasts. I'm especially excited about the back-to-viz-basics channel for sharing work and staying updated on challenges. #Tableau #B2VB #TC25
Join: tabsoft.co/3GslPGe
Join: tabsoft.co/3GslPGe
🚨 Week 7 of #B2VB is live!
This week we’re building a histogram using fake data on teen screen time created with Data Mockstar by Adam Mico!
Challenge details: bit.ly/42mbaFO
#DataChallenge #Tableau #PowerBI
This week we’re building a histogram using fake data on teen screen time created with Data Mockstar by Adam Mico!
Challenge details: bit.ly/42mbaFO
#DataChallenge #Tableau #PowerBI
bit.ly
April 21, 2025 at 8:13 PM
🚨 Week 7 of #B2VB is live!
This week we’re building a histogram using fake data on teen screen time created with Data Mockstar by Adam Mico!
Challenge details: bit.ly/42mbaFO
#DataChallenge #Tableau #PowerBI
This week we’re building a histogram using fake data on teen screen time created with Data Mockstar by Adam Mico!
Challenge details: bit.ly/42mbaFO
#DataChallenge #Tableau #PowerBI
Every time I reach the last day of Tableau Conference, I feel a mix of gratitude, inspiration, and a little bit of sadness. I’m always excited to head home to my family and friends, but leaving this community is never easy. It’s hard to explain what this week really means.
April 17, 2025 at 2:41 PM
Every time I reach the last day of Tableau Conference, I feel a mix of gratitude, inspiration, and a little bit of sadness. I’m always excited to head home to my family and friends, but leaving this community is never easy. It’s hard to explain what this week really means.
Taking off shortly for what I think is my 7th Tableau Conference!! Excited to reconnect with old friends, make new ones, and dive in to all things data! See you all soon ✈️ #TC25
April 14, 2025 at 11:50 AM
Taking off shortly for what I think is my 7th Tableau Conference!! Excited to reconnect with old friends, make new ones, and dive in to all things data! See you all soon ✈️ #TC25
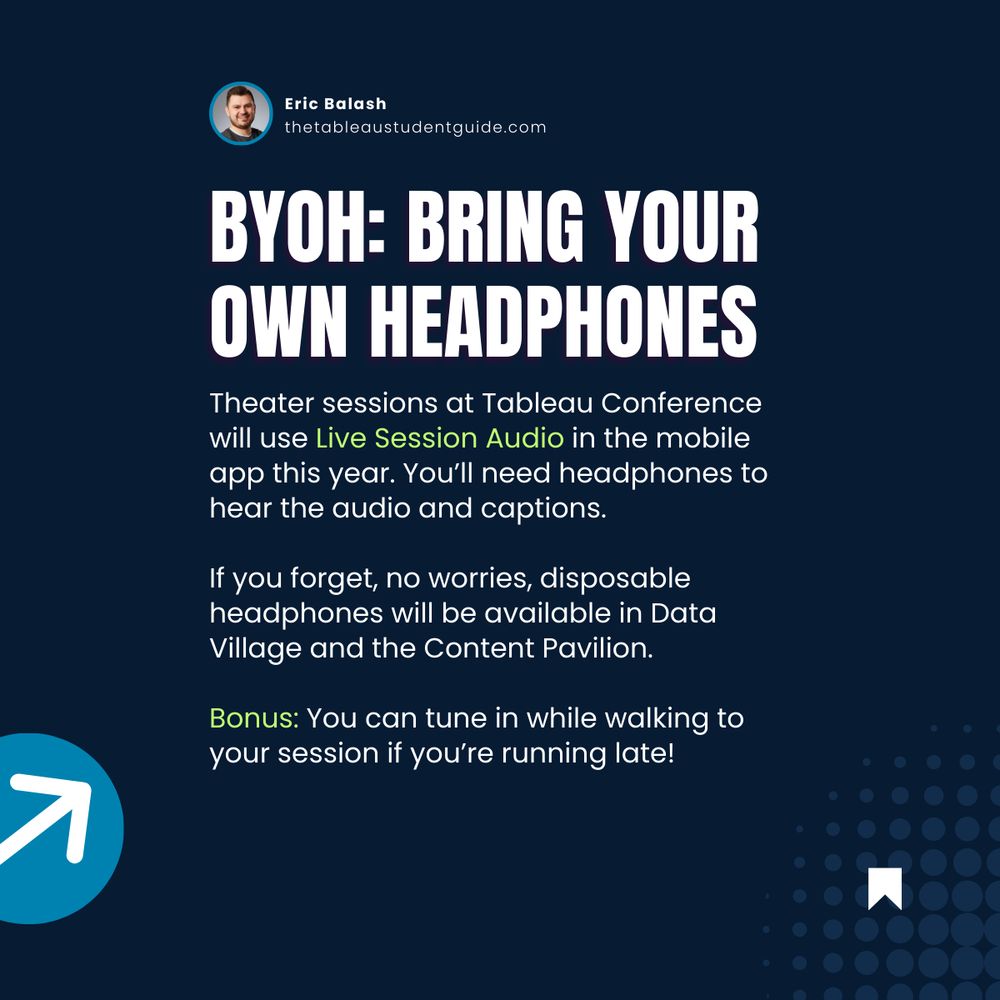
🚨 #TC25 attendees: Don’t forget your headphones!
Theater sessions this year are BYOH! You’ll listen through the event app using Live Session Audio. If you forget, no worries, disposable headphones will be available in Data Village and the Content Pavilion. See you in San Diego!
#Tableau #DATA25
Theater sessions this year are BYOH! You’ll listen through the event app using Live Session Audio. If you forget, no worries, disposable headphones will be available in Data Village and the Content Pavilion. See you in San Diego!
#Tableau #DATA25
April 11, 2025 at 6:09 PM
We’re less than a week away from the biggest data event of the year, Tableau Conference 2025! I’m excited to be presenting two sessions this year 👇
Favorite my sessions: sforce.co/4iDYu2p
#TC25 #Tableau #DataFam
Favorite my sessions: sforce.co/4iDYu2p
#TC25 #Tableau #DataFam
April 9, 2025 at 4:54 PM
We’re less than a week away from the biggest data event of the year, Tableau Conference 2025! I’m excited to be presenting two sessions this year 👇
Favorite my sessions: sforce.co/4iDYu2p
#TC25 #Tableau #DataFam
Favorite my sessions: sforce.co/4iDYu2p
#TC25 #Tableau #DataFam
📢 Back 2 Viz Basics is posted for Week 7! This week's dataset features Goodreads Choice Awards winners and we're building Treemaps. Design, post and share, and submit your vizzes!
Prompt Link: bit.ly/3DYaE7H
#B2VB #DataVisualization #DataChallenge #Tableau #PowerBI
Prompt Link: bit.ly/3DYaE7H
#B2VB #DataVisualization #DataChallenge #Tableau #PowerBI
bit.ly
April 7, 2025 at 12:39 PM
📢 Back 2 Viz Basics is posted for Week 7! This week's dataset features Goodreads Choice Awards winners and we're building Treemaps. Design, post and share, and submit your vizzes!
Prompt Link: bit.ly/3DYaE7H
#B2VB #DataVisualization #DataChallenge #Tableau #PowerBI
Prompt Link: bit.ly/3DYaE7H
#B2VB #DataVisualization #DataChallenge #Tableau #PowerBI
🎙️New Data Afterhours episode!
In S2E6, I chat with Rekha Srivatsan, SVP & CMO of Tableau. We talk gardening, Bravo TV, and how she unwinds outside of work.
🎧Listen here: spoti.fi/4leXCmS or wherever you get your podcasts.
#DataAfterhours #Tableau #Podcast #Leadership
In S2E6, I chat with Rekha Srivatsan, SVP & CMO of Tableau. We talk gardening, Bravo TV, and how she unwinds outside of work.
🎧Listen here: spoti.fi/4leXCmS or wherever you get your podcasts.
#DataAfterhours #Tableau #Podcast #Leadership
April 3, 2025 at 12:20 PM
🎙️New Data Afterhours episode!
In S2E6, I chat with Rekha Srivatsan, SVP & CMO of Tableau. We talk gardening, Bravo TV, and how she unwinds outside of work.
🎧Listen here: spoti.fi/4leXCmS or wherever you get your podcasts.
#DataAfterhours #Tableau #Podcast #Leadership
In S2E6, I chat with Rekha Srivatsan, SVP & CMO of Tableau. We talk gardening, Bravo TV, and how she unwinds outside of work.
🎧Listen here: spoti.fi/4leXCmS or wherever you get your podcasts.
#DataAfterhours #Tableau #Podcast #Leadership
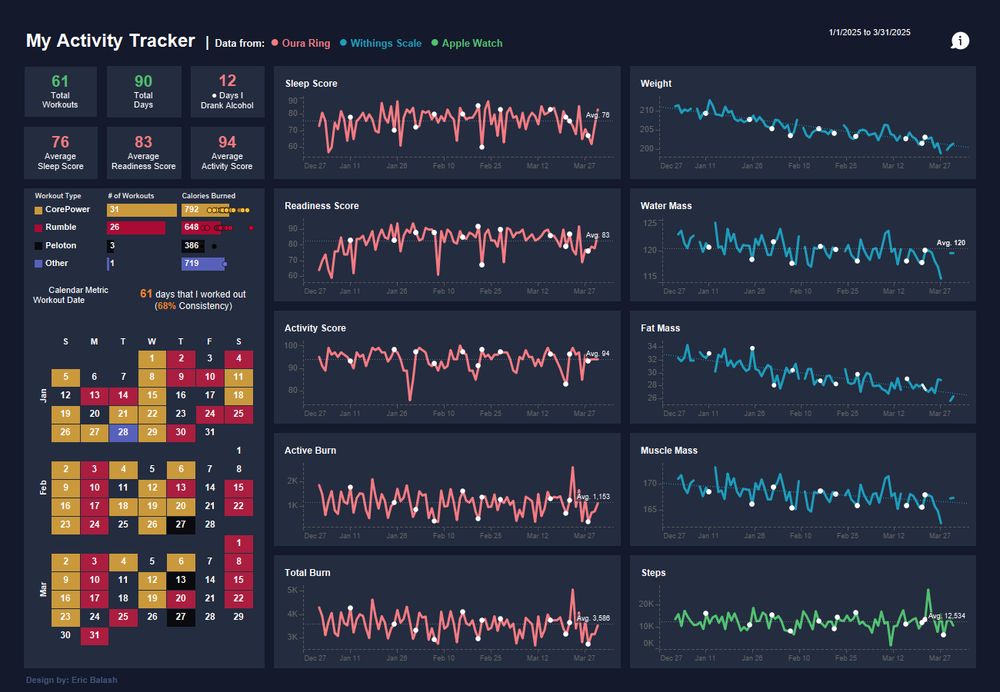
📊 New Dashboard Alert!
I’m starting the year by keeping a closer eye on my health and fitness data. My new Tableau dashboard combines insights from my Oura ring, Withings scale, and Apple Watch, which helps me identify trends and track progress more effectively.
Check it out: tabsoft.co/3G4hRmY
I’m starting the year by keeping a closer eye on my health and fitness data. My new Tableau dashboard combines insights from my Oura ring, Withings scale, and Apple Watch, which helps me identify trends and track progress more effectively.
Check it out: tabsoft.co/3G4hRmY
April 1, 2025 at 9:25 PM
📊 New Dashboard Alert!
I’m starting the year by keeping a closer eye on my health and fitness data. My new Tableau dashboard combines insights from my Oura ring, Withings scale, and Apple Watch, which helps me identify trends and track progress more effectively.
Check it out: tabsoft.co/3G4hRmY
I’m starting the year by keeping a closer eye on my health and fitness data. My new Tableau dashboard combines insights from my Oura ring, Withings scale, and Apple Watch, which helps me identify trends and track progress more effectively.
Check it out: tabsoft.co/3G4hRmY