František Bartoš
@fbartos.bsky.social
840 followers
190 following
68 posts
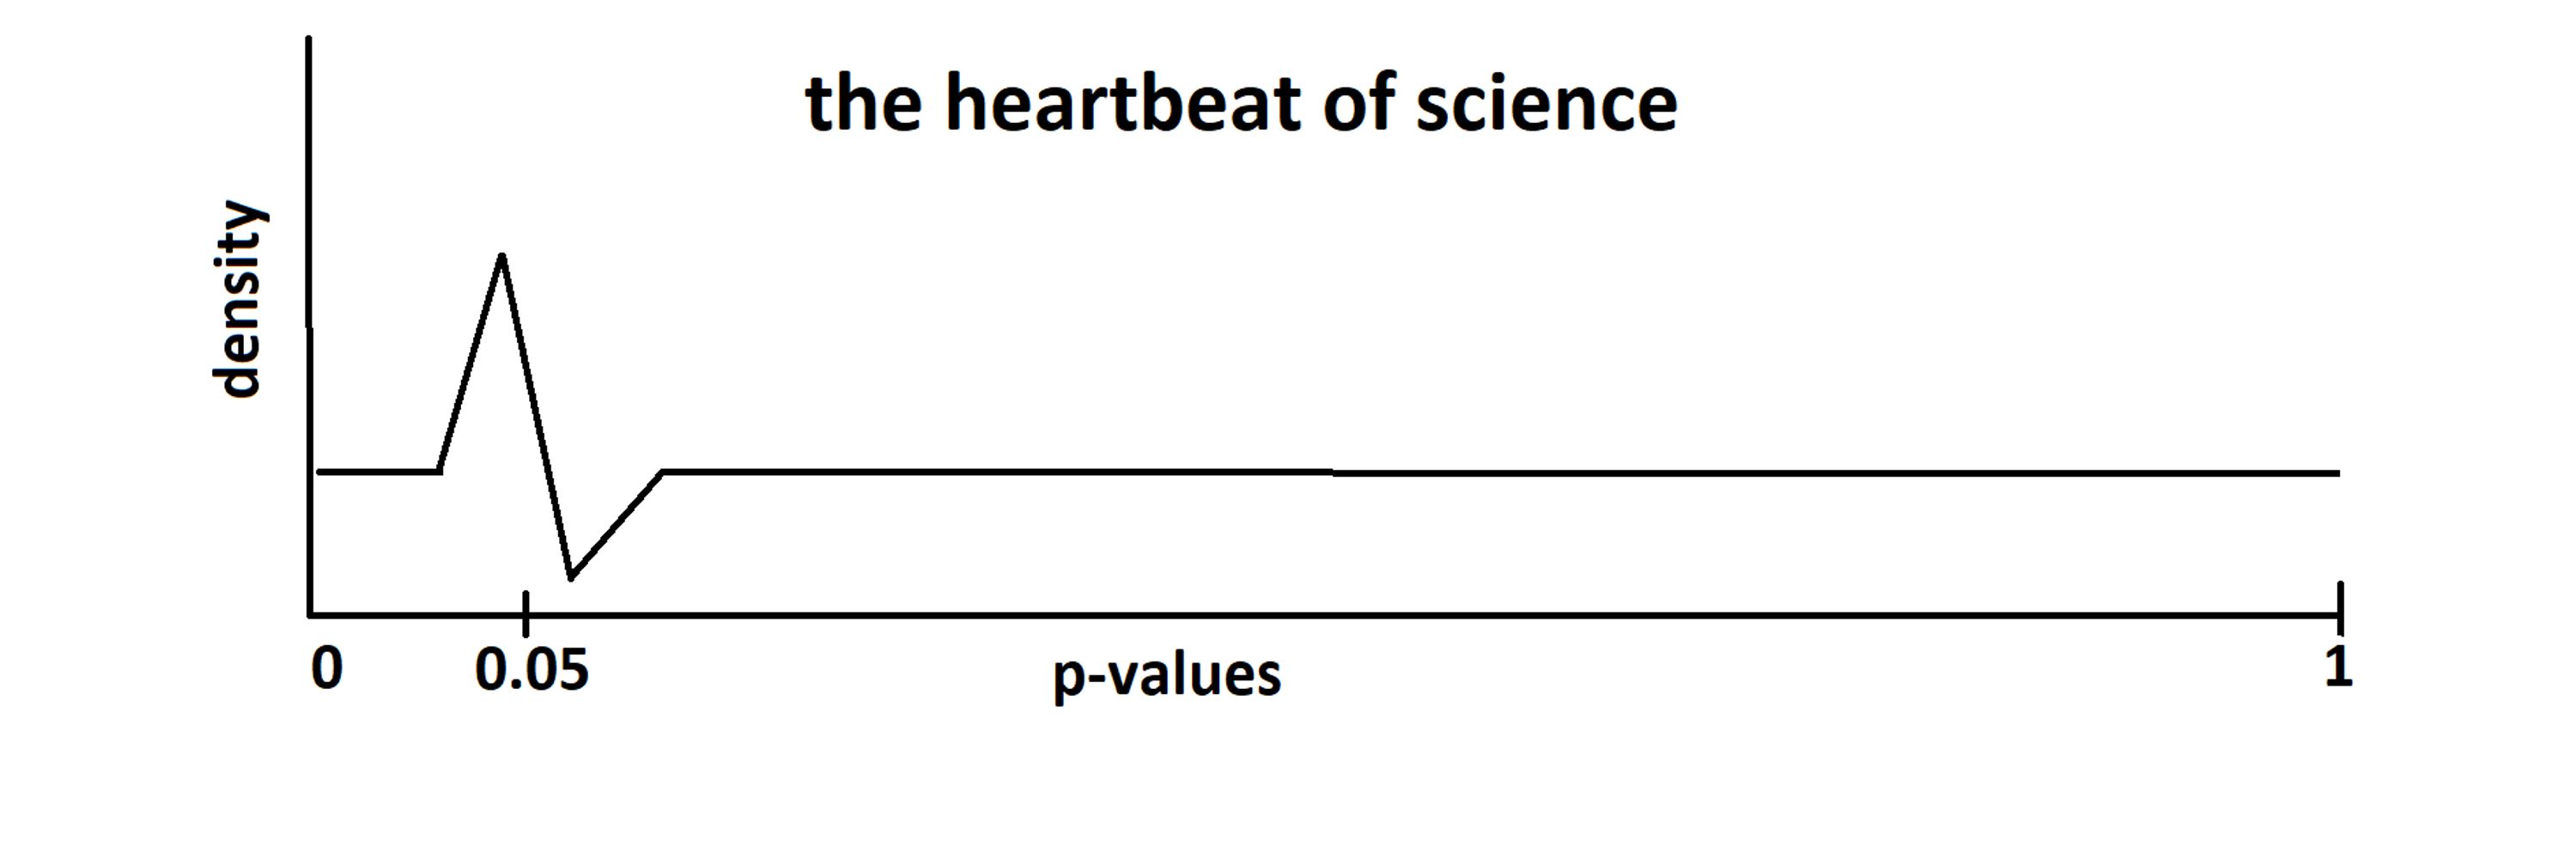
PhD Candidate | Psychological Methods | UvA Amsterdam | interested in statistics, meta-analysis, and publication bias | once flipped a coin too many times
Posts
Media
Videos
Starter Packs
Pinned


Reposted by František Bartoš


Reposted by František Bartoš

Reposted by František Bartoš

JASP
@jaspstats.bsky.social
· 14d
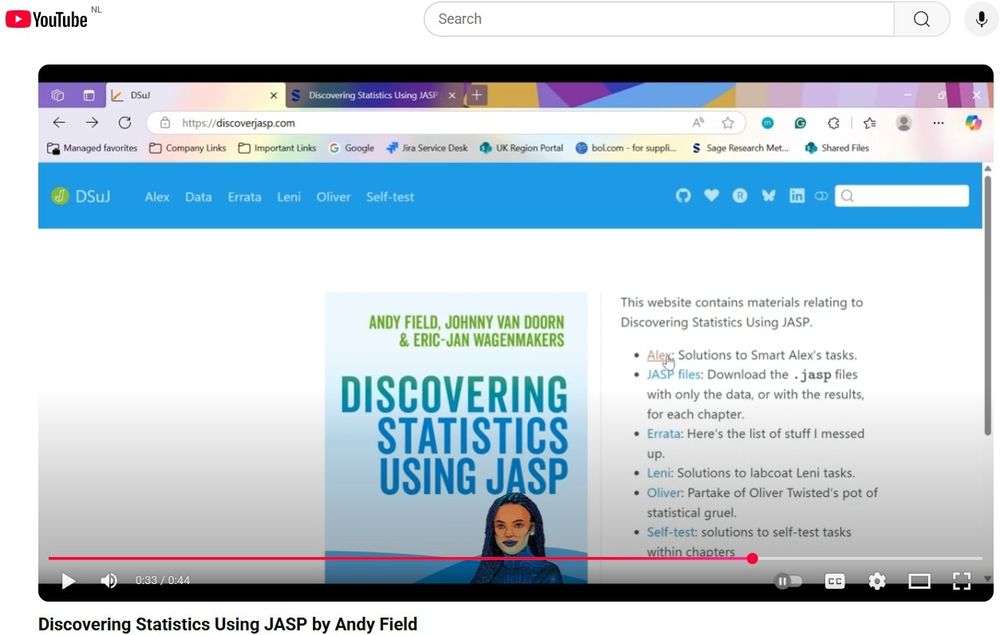
"Discovering Statistics Using JASP": The Promo Video - JASP - Free and User-Friendly Statistical Software
The shiny new textbook “Discovering Statistics Using JASP” now has a 44-second promo video on YouTube, courtesy of Sage. What I like about the video is that it shows some of the pages, so you get an o...
jasp-stats.org


