Nathan Yau
@flowingdata.com
6.7K followers 270 following 190 posts
Playing with data, visualizing it for humans at flowingdata.com
Posts Media Videos Starter Packs
Pinned
flowingdata.com
Dishonest charts are coming from all directions, and they're only going to hit harder. Unless we push back. So, an interactive guide: Defense Against Dishonest Charts flowingdata.com/projects/dis...
Defense Against Dishonest Charts
This is a guide to protect ourselves and to preserve what is good about turning data into visual things.
flowingdata.com
flowingdata.com
Tennessee is missing in the state ranks in the above. The state didn’t collect enough data to be included in the survey data. But in the year prior Tennessee was 50% for men and 39% for men. I’m guessing similar numbers year-over-year.
flowingdata.com
Ha, I was about to say! Fine work
flowingdata.com
Vermont, New Hampshire, and Montana, I was not familiar.
Bar chart showing percentage of adults, by state, who had alcoholic beverage in past 30 days. D.C., Vermont, New Hampshire, and Montana are around 60%.
Reposted by Nathan Yau
npr.org
NPR @npr.org · 7d
Today marks the first day in public media’s history without federal funding. And we’re not going anywhere.

Listeners like you keep our mission alive. Protect one of the last places where America comes together to hear itself.

Stand with us today. Donate at this link: n.pr/46wamAj
Reposted by Nathan Yau
erwanrivault.com
Launch day 🚀

We’ve just released @chartlecc.bsky.social - a daily chart game!

Your job is to guess which country is represented by the red line in today's chart. You get 5 tries, no other clues!

Play today, come back tomorrow for a different chart with new data and share with your chart friends 📈
Chartle - A daily chart game
Guess the country in red by analysing today's chart
chartle.cc
flowingdata.com
With our old friend the beeswarm, we get a bottom-heavy distribution with bumps at the round numbers, about every $20k up to $100k in median salary. Then the jobs grow sparse.
Beeswarm chart showing distribution of median salary by occupation.
flowingdata.com
Still have this hanging out on the wall
Reposted by Nathan Yau
hannahrecht.bsky.social
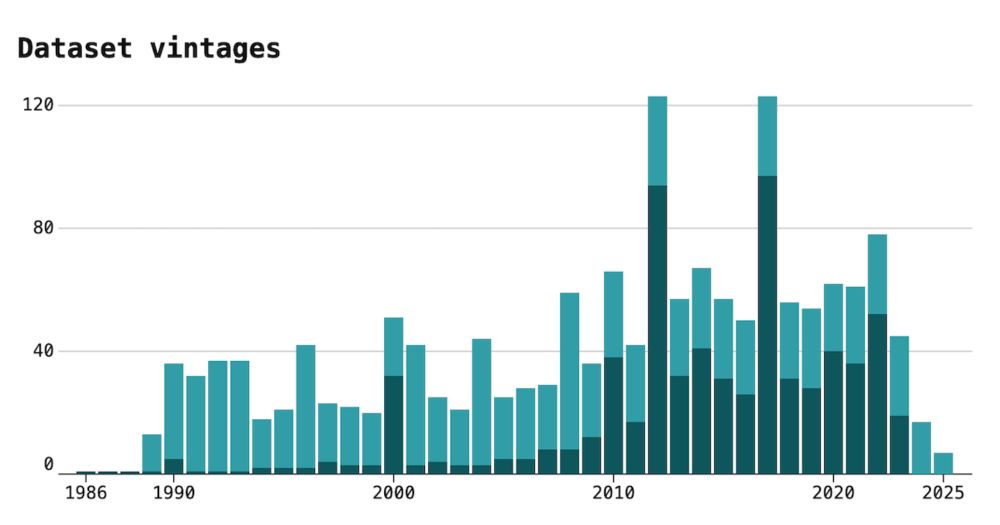
🚀 I made a tracker that shows when the Census Bureau adds or removes datasets from their APIs.
Dashboard at www.hrecht.com/census-api-d... and follow @censusapitracker.bsky.social for major updates.

I've been wanting to build this for years but now seemed an especially important time to keep track.
Tracking Census Dataset Changes
See when the U.S. Census Bureau adds or removes datasets.
www.hrecht.com
flowingdata.com
The loved one would want the real voice, not some convergence of adjectives.
flowingdata.com
A petulant child who accuses you of cheating whenever he loses.
Reposted by Nathan Yau
hansilowang.bsky.social
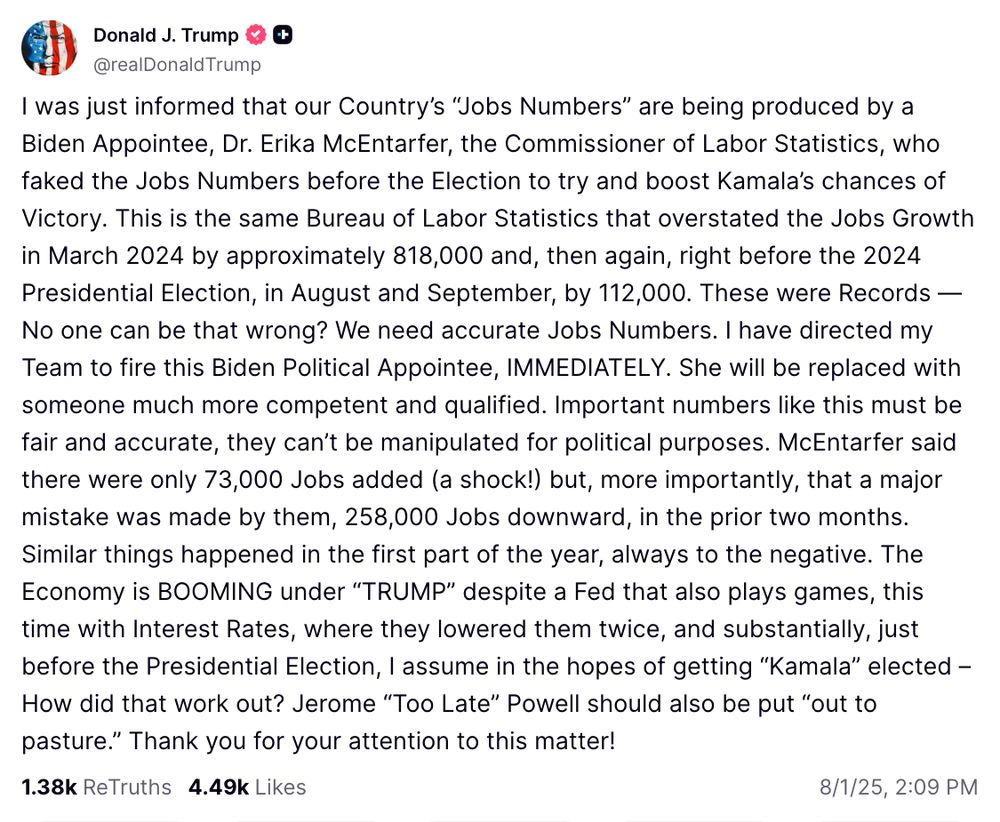
BREAKING: President Trump is calling for the firing of the commissioner of the Bureau of Labor Statistics hours after the federal statistical agency released a weaker-than-expected jobs report
I was just informed that our Country’s “Jobs Numbers” are being produced by a Biden Appointee, Dr. Erika McEntarfer, the Commissioner of Labor Statistics, who faked the Jobs Numbers before the Election to try and boost Kamala’s chances of Victory. This is the same Bureau of Labor Statistics that overstated the Jobs Growth in March 2024 by approximately 818,000 and, then again, right before the 2024 Presidential Election, in August and September, by 112,000. These were Records — No one can be that wrong? We need accurate Jobs Numbers. I have directed my Team to fire this Biden Political Appointee, IMMEDIATELY. She will be replaced with someone much more competent and qualified. Important numbers like this must be fair and accurate, they can’t be manipulated for political purposes. McEntarfer said there were only 73,000 Jobs added (a shock!) but, more importantly, that a major mistake was made by them, 258,000 Jobs downward, in the prior two months. Similar things happened in the first part of the year, always to the negative. The Economy is BOOMING under “TRUMP” despite a Fed that also plays games, this time with Interest Rates, where they lowered them twice, and substantially, just before the Presidential Election, I assume in the hopes of getting “Kamala” elected – How did that work out? Jerome “Too Late” Powell should also be put “out to pasture.” Thank you for your attention to this matter!
flowingdata.com
My favorite bit is the stacks with a Sankey flourish and water lines to indicate flow. This could've easily been five simple stacked bar multiples, but this little part shows that they care.
Stacked bars posing as Sankey diagrams showing most surface water coming from forests
flowingdata.com
Notes of the 1870 Statistical Atlas of the United States, especially in the titles www.loc.gov/item/05019329/
Mosaic plots showing state population. More area for more population in 1870. New York the biggest. Population map from 1870, concentration in the (modern) eastern half of the United States. Title of population map. Smaller description with title "Constitutional Population" in largest print. Center aligned text.
flowingdata.com
Gold star for visuals.
graphics.reuters.com
Congress has passed hundreds of laws protecting federal public lands over the past century through bipartisan efforts and with the support of local governments. Now, Trump’s administration is pushing policies and legislation that upend these protections.

www.reuters.com/graphics/USA...
Eroding protections for public lands
Trump policies reshape the role of federally owned land, against the tide of U.S. public opinion
www.reuters.com