


Foxy Fomo
@foxyfomo.bsky.social
$NVDA
Now sitting below the 50ma.
It dipped below at the beginning of Feb but bounced back up.
If the 50 becomes resistance, it will be the first time in 2 years. Think about this.
$115-$116 acting as support.
Below $113, Lord have mercy.
Now sitting below the 50ma.
It dipped below at the beginning of Feb but bounced back up.
If the 50 becomes resistance, it will be the first time in 2 years. Think about this.
$115-$116 acting as support.
Below $113, Lord have mercy.

March 3, 2025 at 5:51 PM
$NVDA
Now sitting below the 50ma.
It dipped below at the beginning of Feb but bounced back up.
If the 50 becomes resistance, it will be the first time in 2 years. Think about this.
$115-$116 acting as support.
Below $113, Lord have mercy.
Now sitting below the 50ma.
It dipped below at the beginning of Feb but bounced back up.
If the 50 becomes resistance, it will be the first time in 2 years. Think about this.
$115-$116 acting as support.
Below $113, Lord have mercy.
$SPY $SPX
Well folks, we tried to rally.
Support at 5860ish broke.
Are we heading to test the 200ma?
Well folks, we tried to rally.
Support at 5860ish broke.
Are we heading to test the 200ma?

February 28, 2025 at 6:28 PM
$SPY $SPX
Well folks, we tried to rally.
Support at 5860ish broke.
Are we heading to test the 200ma?
Well folks, we tried to rally.
Support at 5860ish broke.
Are we heading to test the 200ma?
$SPX
I would keep an eye on whether or not lower highs are beginning to form here. A pattern that can suddenly define a short term top and that my friends is NOT bullish.
I would keep an eye on whether or not lower highs are beginning to form here. A pattern that can suddenly define a short term top and that my friends is NOT bullish.

February 6, 2025 at 4:00 PM
$SPX
I would keep an eye on whether or not lower highs are beginning to form here. A pattern that can suddenly define a short term top and that my friends is NOT bullish.
I would keep an eye on whether or not lower highs are beginning to form here. A pattern that can suddenly define a short term top and that my friends is NOT bullish.
$ASTS
Weekly chart back above the 20 firmly. Would love to form a base here for continuation. Last time it was above was mid December.
Would love to see more volume but this is moving in the right direction.
Weekly chart back above the 20 firmly. Would love to form a base here for continuation. Last time it was above was mid December.
Would love to see more volume but this is moving in the right direction.

February 5, 2025 at 9:09 PM
$ASTS
Weekly chart back above the 20 firmly. Would love to form a base here for continuation. Last time it was above was mid December.
Would love to see more volume but this is moving in the right direction.
Weekly chart back above the 20 firmly. Would love to form a base here for continuation. Last time it was above was mid December.
Would love to see more volume but this is moving in the right direction.
$TMDX
Forming a bottom on the weekly 8ma, first time since Aug 2024. The 50ma starting to curl up. These are definitely bullish but again, a big volume day would push shorts to cover imo.
Forming a bottom on the weekly 8ma, first time since Aug 2024. The 50ma starting to curl up. These are definitely bullish but again, a big volume day would push shorts to cover imo.

February 5, 2025 at 9:05 PM
$TMDX
Forming a bottom on the weekly 8ma, first time since Aug 2024. The 50ma starting to curl up. These are definitely bullish but again, a big volume day would push shorts to cover imo.
Forming a bottom on the weekly 8ma, first time since Aug 2024. The 50ma starting to curl up. These are definitely bullish but again, a big volume day would push shorts to cover imo.
$AMD
A long standing uptrend line is perhaps the best indicator for gauging a stock's progress. That break on the weekly was a clear don't touch.
Also, we're now below the 200 weekly ma (orange) today. Not worth gambling til we reclaim it imo.
A long standing uptrend line is perhaps the best indicator for gauging a stock's progress. That break on the weekly was a clear don't touch.
Also, we're now below the 200 weekly ma (orange) today. Not worth gambling til we reclaim it imo.


February 5, 2025 at 8:56 PM
$AMD
A long standing uptrend line is perhaps the best indicator for gauging a stock's progress. That break on the weekly was a clear don't touch.
Also, we're now below the 200 weekly ma (orange) today. Not worth gambling til we reclaim it imo.
A long standing uptrend line is perhaps the best indicator for gauging a stock's progress. That break on the weekly was a clear don't touch.
Also, we're now below the 200 weekly ma (orange) today. Not worth gambling til we reclaim it imo.
$TMDX
With positive flight data incoming and more people calling bullshit on a bullshit short report, we've now shave 1% off the short float! (Womp Womp).
Now above the 50ma (green line)
This HAS to hold for our next leg up.
Didn't hold last time.
We need volume!
With positive flight data incoming and more people calling bullshit on a bullshit short report, we've now shave 1% off the short float! (Womp Womp).
Now above the 50ma (green line)
This HAS to hold for our next leg up.
Didn't hold last time.
We need volume!


February 5, 2025 at 1:22 AM
$TMDX
With positive flight data incoming and more people calling bullshit on a bullshit short report, we've now shave 1% off the short float! (Womp Womp).
Now above the 50ma (green line)
This HAS to hold for our next leg up.
Didn't hold last time.
We need volume!
With positive flight data incoming and more people calling bullshit on a bullshit short report, we've now shave 1% off the short float! (Womp Womp).
Now above the 50ma (green line)
This HAS to hold for our next leg up.
Didn't hold last time.
We need volume!
$TMDX
That 200ma weekly is now acting like resistance.
Needs to flip to support to make a convincing case that the pullback is over.
That 200ma weekly is now acting like resistance.
Needs to flip to support to make a convincing case that the pullback is over.
December 23, 2024 at 7:56 PM
$TMDX
That 200ma weekly is now acting like resistance.
Needs to flip to support to make a convincing case that the pullback is over.
That 200ma weekly is now acting like resistance.
Needs to flip to support to make a convincing case that the pullback is over.
$ESPR
Looks like stops were triggered this morning.
Buyers stepped up if you look at the order flow.
Trying to hold above the 100ma here (blue line)
Looks like stops were triggered this morning.
Buyers stepped up if you look at the order flow.
Trying to hold above the 100ma here (blue line)


December 13, 2024 at 4:37 PM
$ESPR
Looks like stops were triggered this morning.
Buyers stepped up if you look at the order flow.
Trying to hold above the 100ma here (blue line)
Looks like stops were triggered this morning.
Buyers stepped up if you look at the order flow.
Trying to hold above the 100ma here (blue line)
$TMDX
Well folks, it looks like a few wet dreams may get fulfilled after all.
$63ish is the 200ma on the weekly chart. I suspect lots of people will be loading up then.
Well folks, it looks like a few wet dreams may get fulfilled after all.
$63ish is the 200ma on the weekly chart. I suspect lots of people will be loading up then.

December 5, 2024 at 7:52 PM
$TMDX
Well folks, it looks like a few wet dreams may get fulfilled after all.
$63ish is the 200ma on the weekly chart. I suspect lots of people will be loading up then.
Well folks, it looks like a few wet dreams may get fulfilled after all.
$63ish is the 200ma on the weekly chart. I suspect lots of people will be loading up then.
$ASML
We need to get above the 50ma (green line) and hold for next leg up.
The last time we were above was July when that first earnings knocked this down.
We need to get above the 50ma (green line) and hold for next leg up.
The last time we were above was July when that first earnings knocked this down.
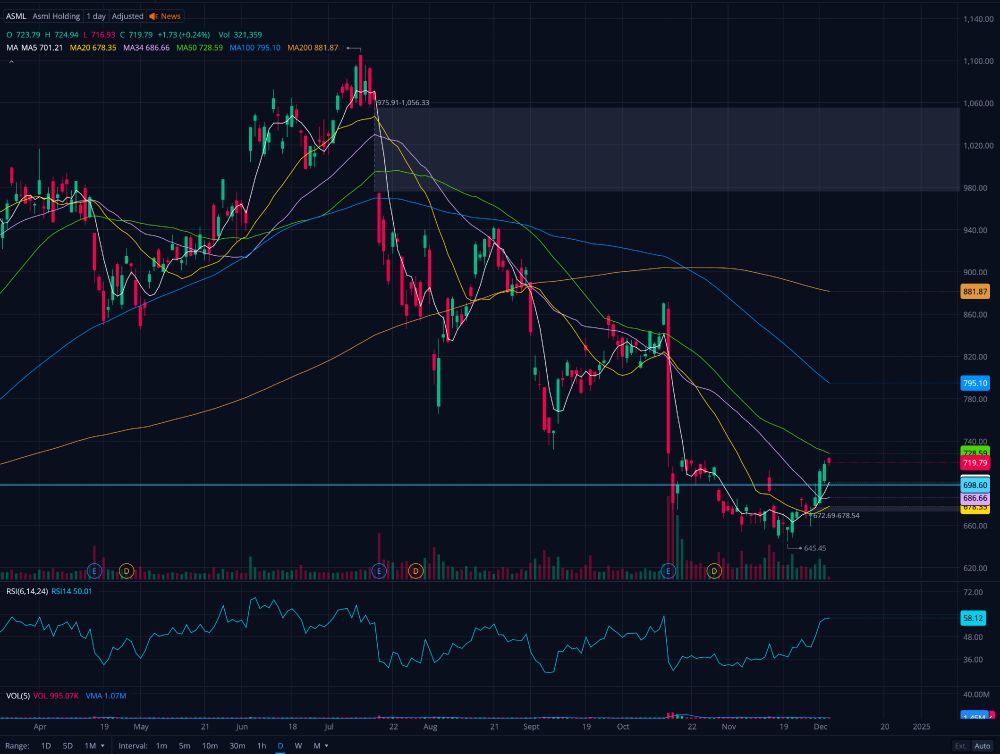
December 4, 2024 at 3:21 PM
$ASML
We need to get above the 50ma (green line) and hold for next leg up.
The last time we were above was July when that first earnings knocked this down.
We need to get above the 50ma (green line) and hold for next leg up.
The last time we were above was July when that first earnings knocked this down.
$NVTS
On the move.
I had highlighted this resistance/support here at $3.50ish clearly on this weekly chart.
On the daily, we've touched the 200ma, first time since January of this year. A break above that and hold and we're off to the races.
On the move.
I had highlighted this resistance/support here at $3.50ish clearly on this weekly chart.
On the daily, we've touched the 200ma, first time since January of this year. A break above that and hold and we're off to the races.


December 4, 2024 at 2:41 PM
$NVTS
On the move.
I had highlighted this resistance/support here at $3.50ish clearly on this weekly chart.
On the daily, we've touched the 200ma, first time since January of this year. A break above that and hold and we're off to the races.
On the move.
I had highlighted this resistance/support here at $3.50ish clearly on this weekly chart.
On the daily, we've touched the 200ma, first time since January of this year. A break above that and hold and we're off to the races.
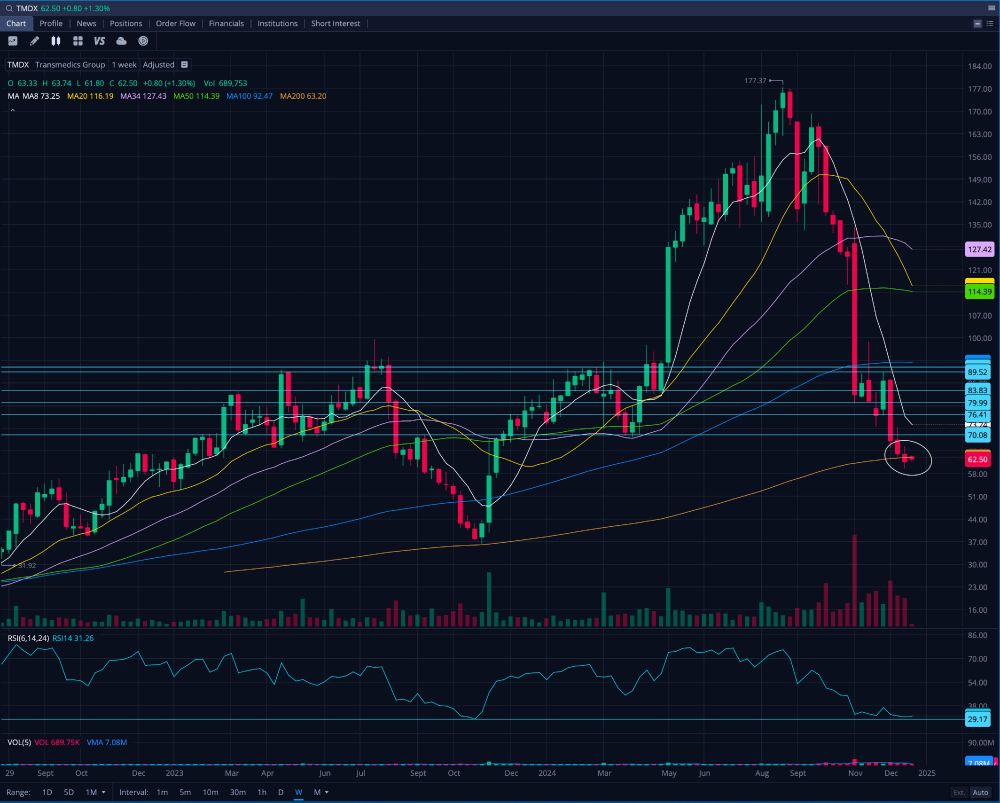
$TMDX
This company is in need of its own organ support.
$70 has acted as strong support but you can see on this weekly chart where I circled the 200 weekly ma which is where people are hoping to yolo in.
We're about to his that oversold spot again so expect some kind of bounce.
This company is in need of its own organ support.
$70 has acted as strong support but you can see on this weekly chart where I circled the 200 weekly ma which is where people are hoping to yolo in.
We're about to his that oversold spot again so expect some kind of bounce.

December 3, 2024 at 5:16 PM
$TMDX
This company is in need of its own organ support.
$70 has acted as strong support but you can see on this weekly chart where I circled the 200 weekly ma which is where people are hoping to yolo in.
We're about to his that oversold spot again so expect some kind of bounce.
This company is in need of its own organ support.
$70 has acted as strong support but you can see on this weekly chart where I circled the 200 weekly ma which is where people are hoping to yolo in.
We're about to his that oversold spot again so expect some kind of bounce.
$ASML
Now above the 34ma, first time since mid-October.
Getting a little overbought here.
I think a break above the 50ma (green line) sends this thing.
Now above the 34ma, first time since mid-October.
Getting a little overbought here.
I think a break above the 50ma (green line) sends this thing.

December 2, 2024 at 6:27 PM
$ASML
Now above the 34ma, first time since mid-October.
Getting a little overbought here.
I think a break above the 50ma (green line) sends this thing.
Now above the 34ma, first time since mid-October.
Getting a little overbought here.
I think a break above the 50ma (green line) sends this thing.
$NVTS
You don't even need to understand charts to see why this is "potentially" significant.
We're above the 100ma and in the past it gets above but gives it back. We need to hold above.
Is it different this time? Recent volume makes me hopeful.
You don't even need to understand charts to see why this is "potentially" significant.
We're above the 100ma and in the past it gets above but gives it back. We need to hold above.
Is it different this time? Recent volume makes me hopeful.

December 2, 2024 at 2:39 PM
$NVTS
You don't even need to understand charts to see why this is "potentially" significant.
We're above the 100ma and in the past it gets above but gives it back. We need to hold above.
Is it different this time? Recent volume makes me hopeful.
You don't even need to understand charts to see why this is "potentially" significant.
We're above the 100ma and in the past it gets above but gives it back. We need to hold above.
Is it different this time? Recent volume makes me hopeful.
$SPX
YUP.
Gap filled.
Do we bounce back up or lower. Let's see.
YUP.
Gap filled.
Do we bounce back up or lower. Let's see.

November 27, 2024 at 5:18 PM
$SPX
YUP.
Gap filled.
Do we bounce back up or lower. Let's see.
YUP.
Gap filled.
Do we bounce back up or lower. Let's see.
$SPX
Likely wants to fill this gap left from yesterday.
On the hour, so far holding the 100ma.
Likely wants to fill this gap left from yesterday.
On the hour, so far holding the 100ma.

November 27, 2024 at 4:19 PM
$SPX
Likely wants to fill this gap left from yesterday.
On the hour, so far holding the 100ma.
Likely wants to fill this gap left from yesterday.
On the hour, so far holding the 100ma.
$TMDX
I could be wrong but this looks like iceberg buying.
When a whale accumulates shares steadily without wanting to go in heavy and spike up the price.
See the consistent 100 share orders.
I could be wrong but this looks like iceberg buying.
When a whale accumulates shares steadily without wanting to go in heavy and spike up the price.
See the consistent 100 share orders.


November 27, 2024 at 3:34 PM
$TMDX
I could be wrong but this looks like iceberg buying.
When a whale accumulates shares steadily without wanting to go in heavy and spike up the price.
See the consistent 100 share orders.
I could be wrong but this looks like iceberg buying.
When a whale accumulates shares steadily without wanting to go in heavy and spike up the price.
See the consistent 100 share orders.
$TMDX
We're at the 20MA (yellow line). Last time we were above was at the start of October.
We need to get above and hold for what I hope is finally the next leg up.
We're at the 20MA (yellow line). Last time we were above was at the start of October.
We need to get above and hold for what I hope is finally the next leg up.

November 27, 2024 at 3:09 PM
$TMDX
We're at the 20MA (yellow line). Last time we were above was at the start of October.
We need to get above and hold for what I hope is finally the next leg up.
We're at the 20MA (yellow line). Last time we were above was at the start of October.
We need to get above and hold for what I hope is finally the next leg up.
$ASPN
The weekly 100ma (blue line) is the last bus stop.
This needs to hold or I see $11 potentially as next major support.
The weekly 100ma (blue line) is the last bus stop.
This needs to hold or I see $11 potentially as next major support.

November 26, 2024 at 5:13 PM
$ASPN
The weekly 100ma (blue line) is the last bus stop.
This needs to hold or I see $11 potentially as next major support.
The weekly 100ma (blue line) is the last bus stop.
This needs to hold or I see $11 potentially as next major support.
$NVTS
Took an entry on this but will likely have a tight stop set.
Volume lately is encouraging but needs to break that blue line (100ma) and HOLD to form a bottom for the next leg up.
Resistance at $3.50 is the ultimate "send it" level we need to break above and hold.
Took an entry on this but will likely have a tight stop set.
Volume lately is encouraging but needs to break that blue line (100ma) and HOLD to form a bottom for the next leg up.
Resistance at $3.50 is the ultimate "send it" level we need to break above and hold.

November 26, 2024 at 5:10 PM
$NVTS
Took an entry on this but will likely have a tight stop set.
Volume lately is encouraging but needs to break that blue line (100ma) and HOLD to form a bottom for the next leg up.
Resistance at $3.50 is the ultimate "send it" level we need to break above and hold.
Took an entry on this but will likely have a tight stop set.
Volume lately is encouraging but needs to break that blue line (100ma) and HOLD to form a bottom for the next leg up.
Resistance at $3.50 is the ultimate "send it" level we need to break above and hold.
$ASPN
Finally above the 5ma. First time since mid October.
Is this a dead cat bounce as per the the RSI or have we bottomed?
Finally above the 5ma. First time since mid October.
Is this a dead cat bounce as per the the RSI or have we bottomed?

November 25, 2024 at 5:57 PM
$ASPN
Finally above the 5ma. First time since mid October.
Is this a dead cat bounce as per the the RSI or have we bottomed?
Finally above the 5ma. First time since mid October.
Is this a dead cat bounce as per the the RSI or have we bottomed?
$OKLO
On the 1-hour chart, it tends to catch a bid there lately. Is this time different?
On the 1-hour chart, it tends to catch a bid there lately. Is this time different?
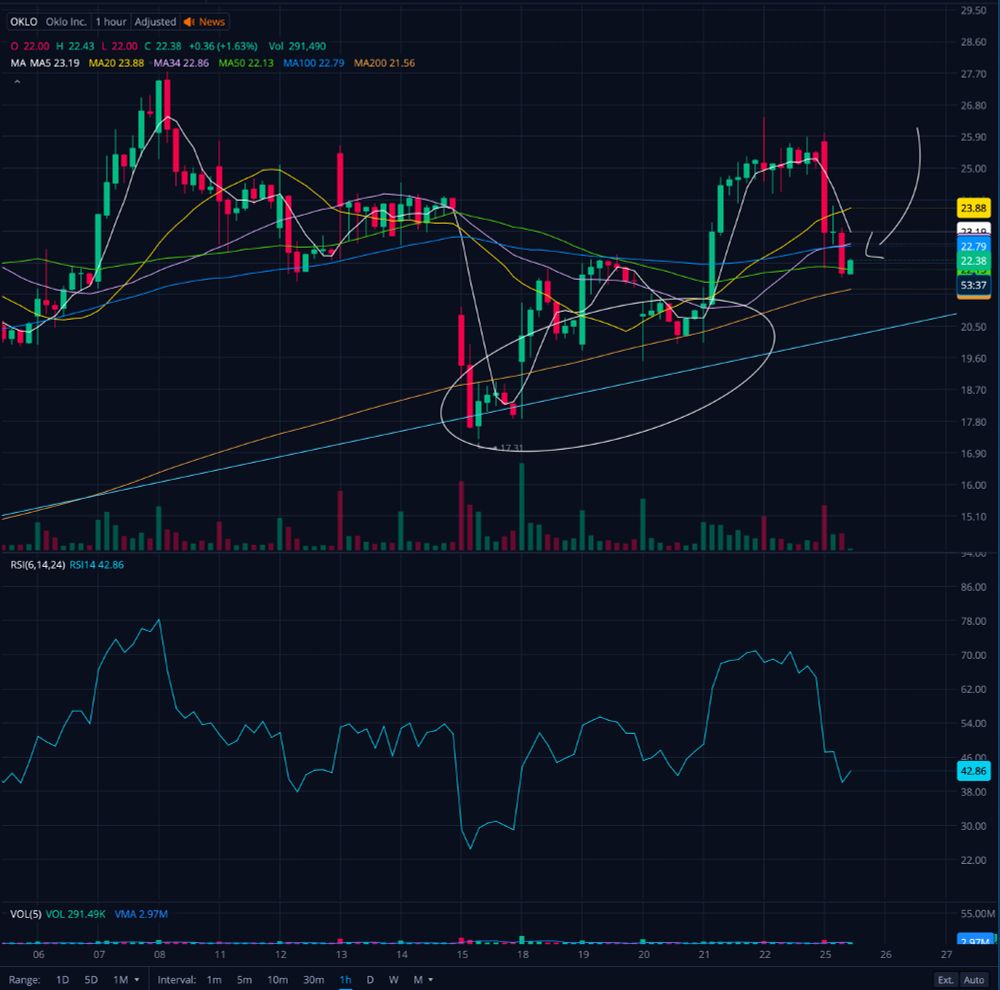
November 25, 2024 at 5:56 PM
$OKLO
On the 1-hour chart, it tends to catch a bid there lately. Is this time different?
On the 1-hour chart, it tends to catch a bid there lately. Is this time different?
$SPX
Keep an eye on the 1-hour chart.
The 200ma is where markets have held lately.
If this breaks we're filling the gap below.
Keep an eye on the 1-hour chart.
The 200ma is where markets have held lately.
If this breaks we're filling the gap below.

November 19, 2024 at 2:44 PM
$SPX
Keep an eye on the 1-hour chart.
The 200ma is where markets have held lately.
If this breaks we're filling the gap below.
Keep an eye on the 1-hour chart.
The 200ma is where markets have held lately.
If this breaks we're filling the gap below.
$IONQ
I mentioned on X that it was due for a breather because the RSI hit historical overbought. This is healthy.
You can on the weekly chart where we topped.
Trying to be patient here.
I mentioned on X that it was due for a breather because the RSI hit historical overbought. This is healthy.
You can on the weekly chart where we topped.
Trying to be patient here.

November 18, 2024 at 5:38 PM
$IONQ
I mentioned on X that it was due for a breather because the RSI hit historical overbought. This is healthy.
You can on the weekly chart where we topped.
Trying to be patient here.
I mentioned on X that it was due for a breather because the RSI hit historical overbought. This is healthy.
You can on the weekly chart where we topped.
Trying to be patient here.