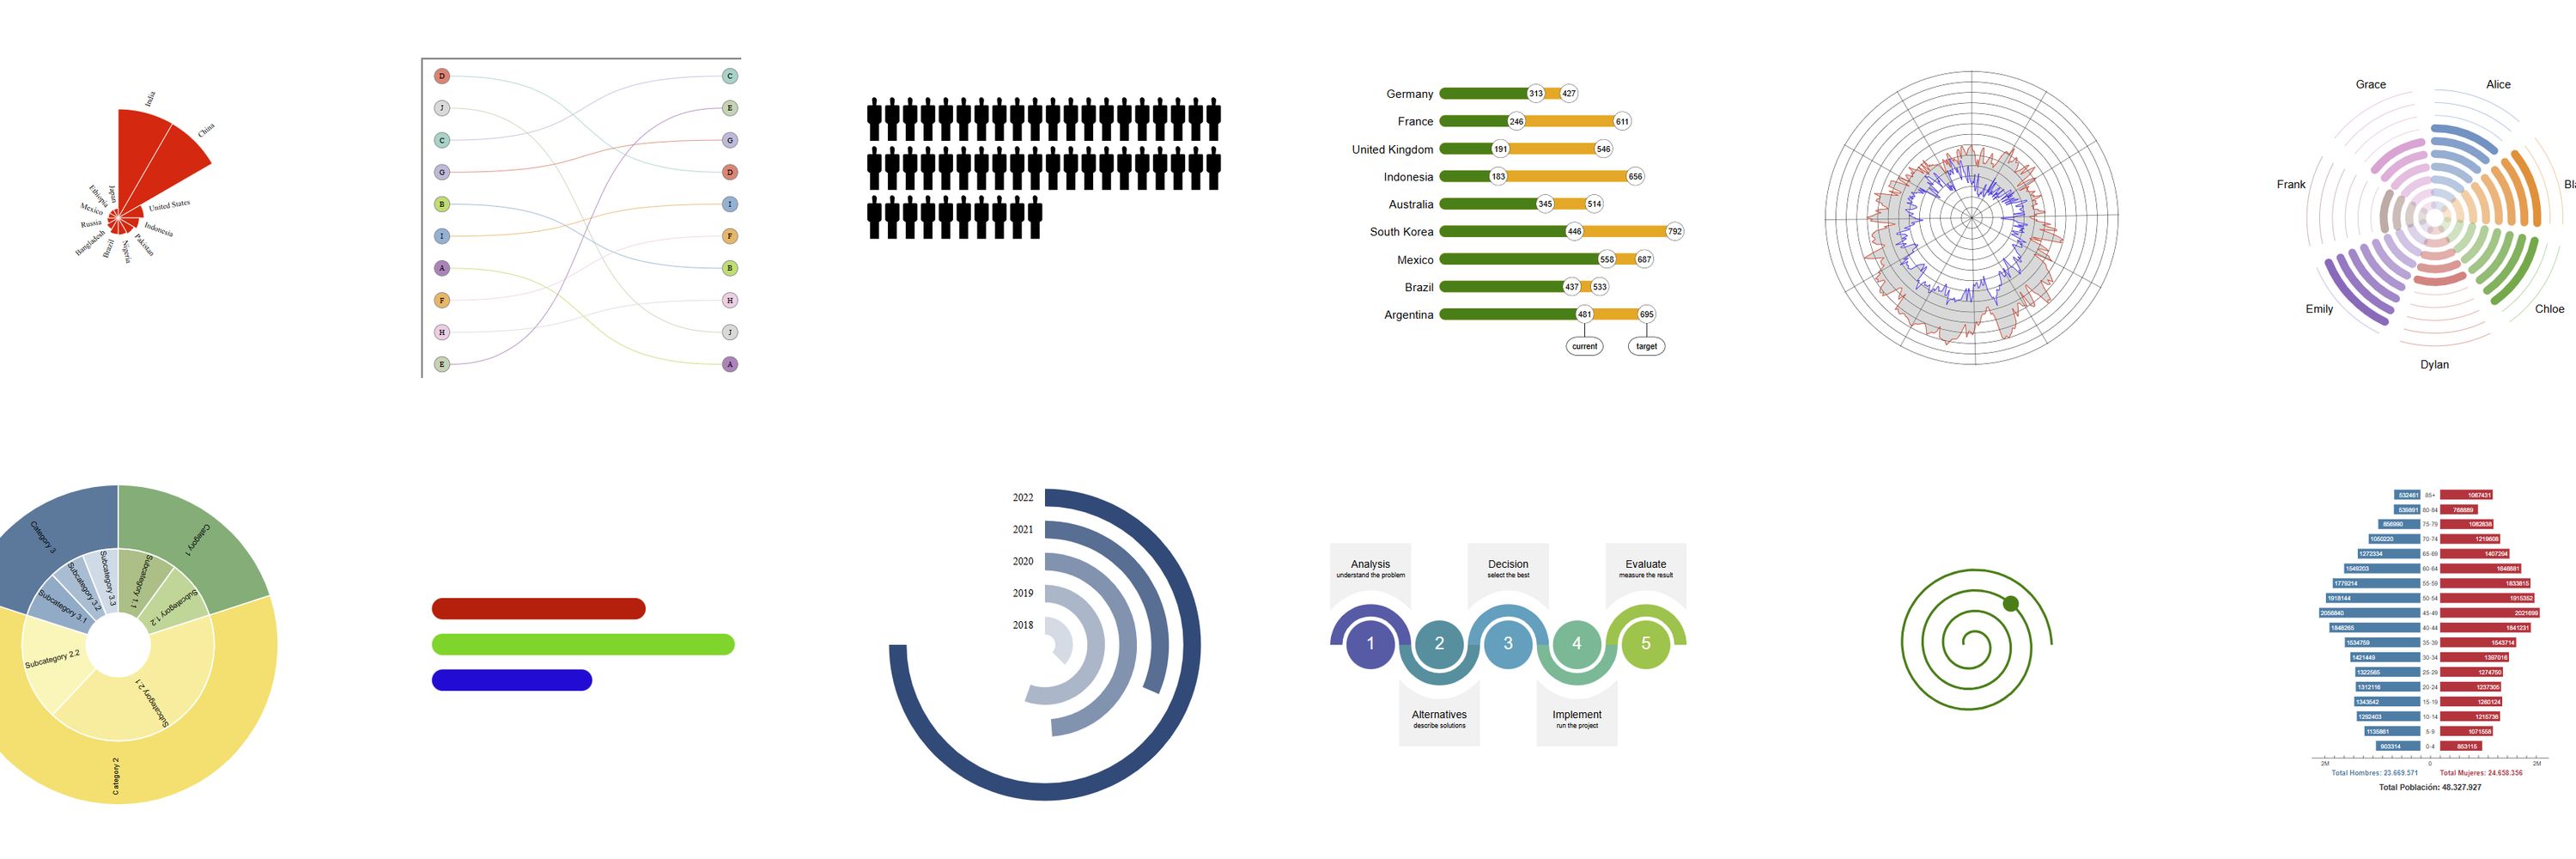
- documentation : https://www.grapper.io/
- examples and playground: https://playground.grapper.io/
🇦🇸 American Samoa leads with 75.21% (WHO, 2022). Diet shifts and sedentary habits are key factors.
👉 See how this chart was made: playground.grapper.io/editor/gggov...
#HealthData #Obesity #DataViz #Grapper

🇦🇸 American Samoa leads with 75.21% (WHO, 2022). Diet shifts and sedentary habits are key factors.
👉 See how this chart was made: playground.grapper.io/editor/gggov...
#HealthData #Obesity #DataViz #Grapper
Chart showing how min (blue) and max (red) temps change through the year. The shaded area shows their average variation and seasonal contrast.
👉 Made with Grapper: playground.grapper.io/editor/gu5oy...
#DataViz #Climate #RadialChart #Grapper

Chart showing how min (blue) and max (red) temps change through the year. The shaded area shows their average variation and seasonal contrast.
👉 Made with Grapper: playground.grapper.io/editor/gu5oy...
#DataViz #Climate #RadialChart #Grapper
We perceive area, not radius — doubling the radius shows 4× the value.
Scale by area to stay accurate. 📊
👉 Learn more: blog.grapper.io/the-circle-s...
#DataViz #Graphane #DataDesign

We perceive area, not radius — doubling the radius shows 4× the value.
Scale by area to stay accurate. 📊
👉 Learn more: blog.grapper.io/the-circle-s...
#DataViz #Graphane #DataDesign
21.4% of the EU population faces poverty or social exclusion.
Inequality persists — inclusion and social protection are essential for a fairer Europe.
📊 Made with Grapper → playground.grapper.io/editor/gimsz...
#DataViz #EU #Inequality #Grapper

21.4% of the EU population faces poverty or social exclusion.
Inequality persists — inclusion and social protection are essential for a fairer Europe.
📊 Made with Grapper → playground.grapper.io/editor/gimsz...
#DataViz #EU #Inequality #Grapper
With Grapper, the g-bind: directive updates your SVGs automatically when data changes — speeding dev, keeping code clean, and enabling dynamic, reactive visuals.
🔗 Read more: blog.grapper.io/understandin...
#DataViz #Frontend #SVG #Reactivity #Grapper

With Grapper, the g-bind: directive updates your SVGs automatically when data changes — speeding dev, keeping code clean, and enabling dynamic, reactive visuals.
🔗 Read more: blog.grapper.io/understandin...
#DataViz #Frontend #SVG #Reactivity #Grapper
In real-time data viz, every ms counts.
Our SVG-based micro-framework achieves sub-ms reactivity — no virtual DOM, no extra renders.
Performance is design.
🔗 blog.grapper.io/speed-and-us...
#UX #DataViz #Grapper

In real-time data viz, every ms counts.
Our SVG-based micro-framework achieves sub-ms reactivity — no virtual DOM, no extra renders.
Performance is design.
🔗 blog.grapper.io/speed-and-us...
#UX #DataViz #Grapper
Today, size isn’t everything, but it’s key for first loads, slow connections, or choosing simple, modular libraries.
⚡ What matters: speed, smoothness, and stability. That’s what Grapper delivers.
👉 Learn more on our blog: medium.com/graphane/doe...

Today, size isn’t everything, but it’s key for first loads, slow connections, or choosing simple, modular libraries.
⚡ What matters: speed, smoothness, and stability. That’s what Grapper delivers.
👉 Learn more on our blog: medium.com/graphane/doe...

Day 5 (ranking): #30DayChartChallenge
#DataViz #DataVisualization #SportData #Graphane
playground.graphane.dev/editor/gs5ss...

Day 5 (ranking): #30DayChartChallenge
#DataViz #DataVisualization #SportData #Graphane
playground.graphane.dev/editor/gs5ss...
#30DayChartChallenge #DataViz #CEO #Fortune500
playground.graphane.dev/editor/gfx7h...

#30DayChartChallenge #DataViz #CEO #Fortune500
playground.graphane.dev/editor/gfx7h...
This graph visualizes the daily rainfall in Brussels over the course of a year. Each circle represents the amount of rain recorded on a specific day.
#30DayChartChallenge #RainInBrussels #WeatherData #DataVisualization #Graphane
playground.graphane.dev/editor/grnn2...
This graph visualizes the daily rainfall in Brussels over the course of a year. Each circle represents the amount of rain recorded on a specific day.
#30DayChartChallenge #RainInBrussels #WeatherData #DataVisualization #Graphane
playground.graphane.dev/editor/grnn2...
playground.graphane.dev/editor/gs5ss...

playground.graphane.dev/editor/gs5ss...
playground.graphane.dev/editor/gmw2m...

playground.graphane.dev/editor/gmw2m...


