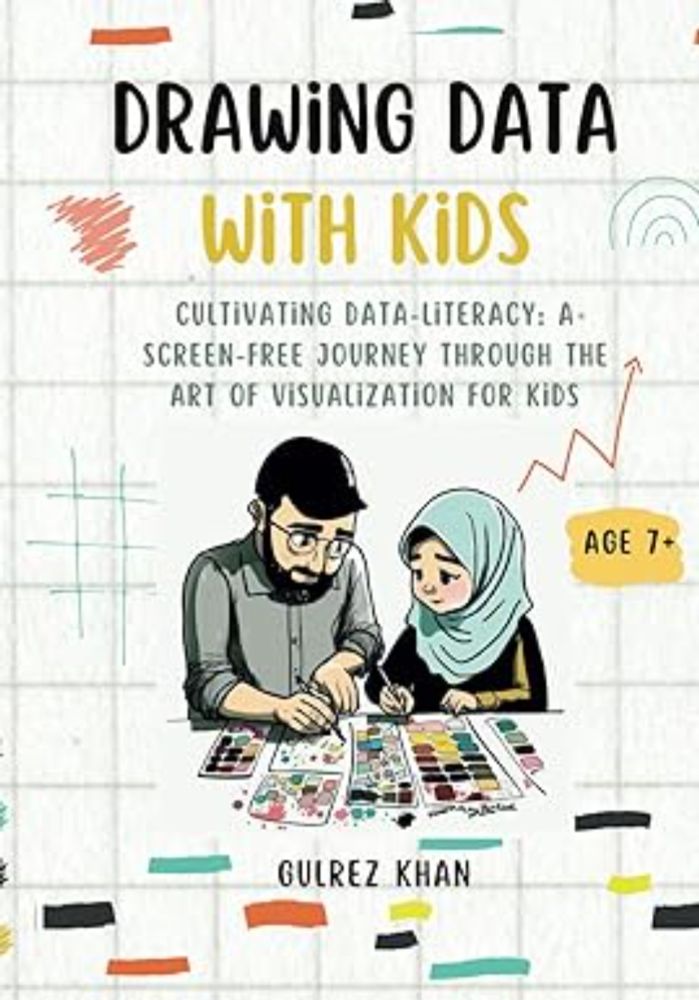
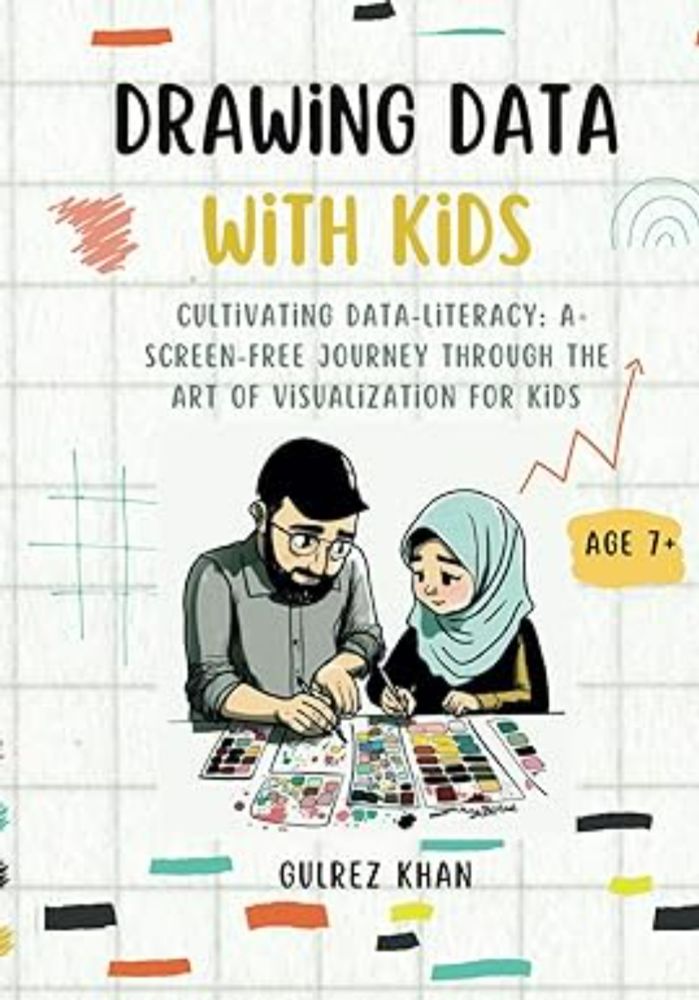
📊 Explore the unique intersection of data viz and daily devotion in Gulrez Khan's latest piece, featuring a heartwarming moment with his curious 7-year-old son as they explore daily lives changed by the start of Ramadan.
With bots all around, it’s time for some genuine human stories.
Come, laugh, cry, and experience the power of data storytelling in my signature half-day workshop. Early bird tickets are now available—secure your spot and bring a friend along..
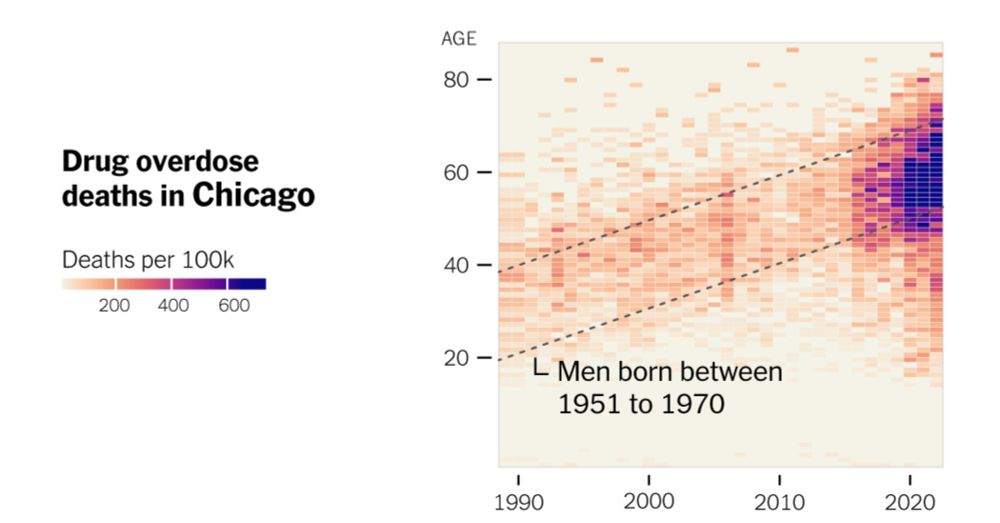
This investigation was in partnership with The Baltimore Banner, Big Local News and nine other newsrooms across the country. www.nytimes.com/2024/12/20/u...
The holiday rush can become quite hectic. Here's a fun exercise to try: 1) Invite your kids to compile a list of all the items they wish for 2) Sort in: Wants and Needs 3) What makes certain items as "needs or wants" 4) use this introduce them to Bar Charts Values & skills drawingdatawithkids.com
This approach mirrors our homeschooling method: when our kids were learning to read the focus was to make them fall in love with reading instead of getting them to learn phonics first :)
By using relatable data from their everyday lives, such as analyzing board game scores and similar datasets, I discovered they became more engaged and curious about the outcomes.
Having worked within Growth teams, I view this as the creation of clusters representing different user types, leading to tailored approaches for each case. When I wrote #DrawingDataWithKids, my primary goal was to inspire a love for data in children.
As I glance at the recent orders of #DrawingDataWithKids 📊 I see shipments destined for the #usa , #uk , #india , #pakistan , #japan , #spain and #australia .
I realize they're reaching places I've yet to venture.