


@hockeyskytte.bsky.social
The first line in the tooltip is the Team name. The color (like the markers) depends on the Team perspective. It's difficult to see on that background for Boston and Minnesota.
It sure needs a little work. You could do Team logo or perhaps go with a player image.
It sure needs a little work. You could do Team logo or perhaps go with a player image.
October 6, 2025 at 9:35 PM
The first line in the tooltip is the Team name. The color (like the markers) depends on the Team perspective. It's difficult to see on that background for Boston and Minnesota.
It sure needs a little work. You could do Team logo or perhaps go with a player image.
It sure needs a little work. You could do Team logo or perhaps go with a player image.
Thanks!
I'm honestly not 100% sold that the tooltip bring much value. I might just drop it all together... But if I don't I should definitely tighten the margins.
I'm honestly not 100% sold that the tooltip bring much value. I might just drop it all together... But if I don't I should definitely tighten the margins.
October 6, 2025 at 9:18 PM
Thanks!
I'm honestly not 100% sold that the tooltip bring much value. I might just drop it all together... But if I don't I should definitely tighten the margins.
I'm honestly not 100% sold that the tooltip bring much value. I might just drop it all together... But if I don't I should definitely tighten the margins.
That's it for now. Let me know what you think, and particularly let me know if you would be interested in video tagging some PWHL games.
I've tried to build the Shotplotter, so it's as easy as possible to add video tags to existing data.
I've tried to build the Shotplotter, so it's as easy as possible to add video tags to existing data.
October 6, 2025 at 8:37 PM
That's it for now. Let me know what you think, and particularly let me know if you would be interested in video tagging some PWHL games.
I've tried to build the Shotplotter, so it's as easy as possible to add video tags to existing data.
I've tried to build the Shotplotter, so it's as easy as possible to add video tags to existing data.
Just a few comments on the PWHL play-by-play data:
1) It includes blocked shots, but not missed shots for some reason.
2) There's no Strength State, so the Strength State is calculated (there are mistakes!)
1) It includes blocked shots, but not missed shots for some reason.
2) There's no Strength State, so the Strength State is calculated (there are mistakes!)
October 6, 2025 at 8:37 PM
Just a few comments on the PWHL play-by-play data:
1) It includes blocked shots, but not missed shots for some reason.
2) There's no Strength State, so the Strength State is calculated (there are mistakes!)
1) It includes blocked shots, but not missed shots for some reason.
2) There's no Strength State, so the Strength State is calculated (there are mistakes!)
Finally, you have the Video tool. Now, I've only video-tagged one game, so there's not a whole lot of video there.
You can filter the data, so for instance you can see all shots by a specific player.
You can filter the data, so for instance you can see all shots by a specific player.

October 6, 2025 at 8:37 PM
Finally, you have the Video tool. Now, I've only video-tagged one game, so there's not a whole lot of video there.
You can filter the data, so for instance you can see all shots by a specific player.
You can filter the data, so for instance you can see all shots by a specific player.
You also have the more classical Table view. The tables can be downloaded.

October 6, 2025 at 8:36 PM
You also have the more classical Table view. The tables can be downloaded.
You can also see Shot attempts on a Heat map. Each of the zones are clickable, so you can focus on a specific area.

October 6, 2025 at 8:36 PM
You can also see Shot attempts on a Heat map. Each of the zones are clickable, so you can focus on a specific area.
On the Report page on the PWHL App you can analyse the Play-by-Play data.
I will add xG later, but unfortunately we don't On-Ice information (except on goals).
Here you see Shot maps for and against for Boston Fleet.
I will add xG later, but unfortunately we don't On-Ice information (except on goals).
Here you see Shot maps for and against for Boston Fleet.

October 6, 2025 at 8:35 PM
On the Report page on the PWHL App you can analyse the Play-by-Play data.
I will add xG later, but unfortunately we don't On-Ice information (except on goals).
Here you see Shot maps for and against for Boston Fleet.
I will add xG later, but unfortunately we don't On-Ice information (except on goals).
Here you see Shot maps for and against for Boston Fleet.
This is particularly interesting for the PWHL because all games are publicly available on YouTube. This means you can use the Shotplotter to add videos to events from the Play-by-Play data.
Let me know if you have any interest of helping out with that part.
Let me know if you have any interest of helping out with that part.
October 6, 2025 at 8:35 PM
This is particularly interesting for the PWHL because all games are publicly available on YouTube. This means you can use the Shotplotter to add videos to events from the Play-by-Play data.
Let me know if you have any interest of helping out with that part.
Let me know if you have any interest of helping out with that part.
Likewise, you can import the Play-by-Play data into the shotplotter:
sports-tagging.netlify.app/hockey/
sports-tagging.netlify.app/hockey/

October 6, 2025 at 8:34 PM
Likewise, you can import the Play-by-Play data into the shotplotter:
sports-tagging.netlify.app/hockey/
sports-tagging.netlify.app/hockey/
The downloaded lineups can then be imported into the Shotplotter if you want:
sports-tagging.netlify.app/hockey/teams
sports-tagging.netlify.app/hockey/teams

October 6, 2025 at 8:34 PM
The downloaded lineups can then be imported into the Shotplotter if you want:
sports-tagging.netlify.app/hockey/teams
sports-tagging.netlify.app/hockey/teams
That will take you to the game page where you can see and download (export CSV) lineups and play-by-play data.
The Strength State calculations need a little work - Particularly for blocked shots... But it's not the easiest thing to calculate Strength from directly from PBP.
The Strength State calculations need a little work - Particularly for blocked shots... But it's not the easiest thing to calculate Strength from directly from PBP.


October 6, 2025 at 8:33 PM
That will take you to the game page where you can see and download (export CSV) lineups and play-by-play data.
The Strength State calculations need a little work - Particularly for blocked shots... But it's not the easiest thing to calculate Strength from directly from PBP.
The Strength State calculations need a little work - Particularly for blocked shots... But it's not the easiest thing to calculate Strength from directly from PBP.
The schedule and Game data is taken directly from PWHL, so it should always be up to date with the league.
You can click on a specific game (if it has been played).
You can click on a specific game (if it has been played).

October 6, 2025 at 8:33 PM
The schedule and Game data is taken directly from PWHL, so it should always be up to date with the league.
You can click on a specific game (if it has been played).
You can click on a specific game (if it has been played).
You can also see tables with data, and there's a video player function.
Here you can filter the events, and you can click in the table to play that specific. You can go back and fourth between events and choose how much you want to play before and after the event.
Here you can filter the events, and you can click in the table to play that specific. You can go back and fourth between events and choose how much you want to play before and after the event.

September 26, 2025 at 11:17 PM
You can also see tables with data, and there's a video player function.
Here you can filter the events, and you can click in the table to play that specific. You can go back and fourth between events and choose how much you want to play before and after the event.
Here you can filter the events, and you can click in the table to play that specific. You can go back and fourth between events and choose how much you want to play before and after the event.
If you go to Heat Maps you can see the events by zone. The zones are a little different in the hockey app, but the concept is the same.

September 26, 2025 at 11:17 PM
If you go to Heat Maps you can see the events by zone. The zones are a little different in the hockey app, but the concept is the same.
In the Report pages you can analyze the data. Here's data from a few floorball games.

September 26, 2025 at 11:16 PM
In the Report pages you can analyze the data. Here's data from a few floorball games.
Once you have tagged a game you can export the game data, and after that you can always import it back to the App. You can easily import multiple CSV files for analysis.
September 26, 2025 at 11:16 PM
Once you have tagged a game you can export the game data, and after that you can always import it back to the App. You can easily import multiple CSV files for analysis.
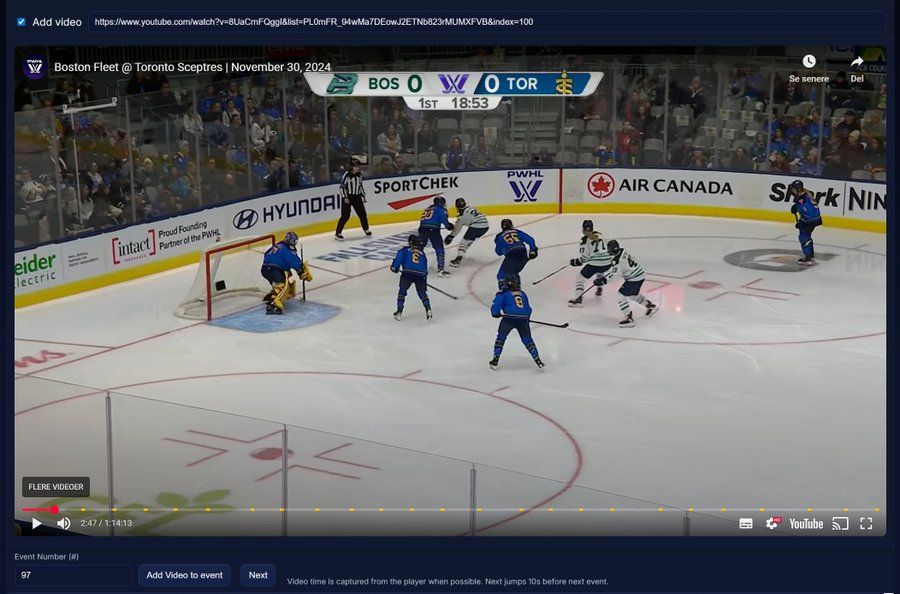
You can also add videos to the event. I'm not quite sure how well YouTube videos work, but from a normal video URL it will automatically grab the video time from the player, and add it to the shot table.

September 26, 2025 at 11:15 PM
You can also add videos to the event. I'm not quite sure how well YouTube videos work, but from a normal video URL it will automatically grab the video time from the player, and add it to the shot table.
You can add Shot Aim to a Shot.

September 26, 2025 at 11:15 PM
You can add Shot Aim to a Shot.
The players will autofill based on the lines selection, but you can also manually change the player numbers, if mixed lines are on the ice.

September 26, 2025 at 11:14 PM
The players will autofill based on the lines selection, but you can also manually change the player numbers, if mixed lines are on the ice.
Once you have filled out the team lists you can start plotting shots.
Under Shot details you can choose Team, Event type, Period, Strength State Perspective, Strength State, Player 1 (shooter), Player 2 (e.g. shot blocker), Forward lines, defensive lines.
Under Shot details you can choose Team, Event type, Period, Strength State Perspective, Strength State, Player 1 (shooter), Player 2 (e.g. shot blocker), Forward lines, defensive lines.

September 26, 2025 at 11:14 PM
Once you have filled out the team lists you can start plotting shots.
Under Shot details you can choose Team, Event type, Period, Strength State Perspective, Strength State, Player 1 (shooter), Player 2 (e.g. shot blocker), Forward lines, defensive lines.
Under Shot details you can choose Team, Event type, Period, Strength State Perspective, Strength State, Player 1 (shooter), Player 2 (e.g. shot blocker), Forward lines, defensive lines.