


James Mahmud Rice
@jamesmahmudrice.info
Sociologist in the Demography And Ageing Unit, Melbourne School Of Population And Global Health, University Of Melbourne
www.jamesmahmudrice.info
www.jamesmahmudrice.info
When children are included, it is clear that changes to net public transfers have favoured both younger and older people.
For a more detailed discussion, see:
bsky.app/profile/jame...
For a more detailed discussion, see:
bsky.app/profile/jame...
October 30, 2025 at 12:51 AM
When children are included, it is clear that changes to net public transfers have favoured both younger and older people.
For a more detailed discussion, see:
bsky.app/profile/jame...
For a more detailed discussion, see:
bsky.app/profile/jame...
Here is a figure which includes children, taken from Rice et al, "Intergenerational inequality and the intergenerational state", 2021:
doi.org/10.1007/s125...
rdcu.be/cylFh (full-text, view-only)
doi.org/10.1007/s125...
rdcu.be/cylFh (full-text, view-only)

October 30, 2025 at 12:51 AM
Here is a figure which includes children, taken from Rice et al, "Intergenerational inequality and the intergenerational state", 2021:
doi.org/10.1007/s125...
rdcu.be/cylFh (full-text, view-only)
doi.org/10.1007/s125...
rdcu.be/cylFh (full-text, view-only)
This figure is misleading. Notice how the chart does not include children, even though, as the article states:
"People receive benefits from the state as a child. They attend childcare paid for by government subsidies and they get a free (public) or subsidised (private) education."
"People receive benefits from the state as a child. They attend childcare paid for by government subsidies and they get a free (public) or subsidised (private) education."
October 30, 2025 at 12:51 AM
This figure is misleading. Notice how the chart does not include children, even though, as the article states:
"People receive benefits from the state as a child. They attend childcare paid for by government subsidies and they get a free (public) or subsidised (private) education."
"People receive benefits from the state as a child. They attend childcare paid for by government subsidies and they get a free (public) or subsidised (private) education."
The photo is of the La Trobe Reading Room, State Library Victoria, in Melbourne, Australia, as viewed from the 5th floor.
It's by David Iliff (license: creativecommons.org/licenses/by-...).
It's by David Iliff (license: creativecommons.org/licenses/by-...).
Deed - Attribution-ShareAlike 3.0 Unported
- Creative Commons
creativecommons.org
August 6, 2025 at 2:29 AM
The photo is of the La Trobe Reading Room, State Library Victoria, in Melbourne, Australia, as viewed from the 5th floor.
It's by David Iliff (license: creativecommons.org/licenses/by-...).
It's by David Iliff (license: creativecommons.org/licenses/by-...).
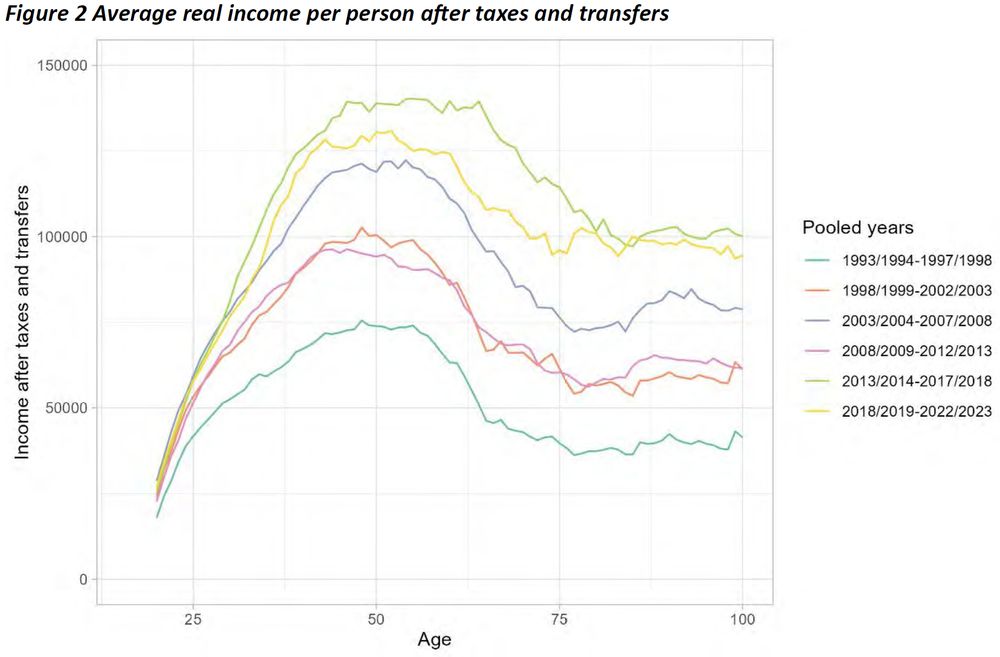
ANU study: "Australians over the age of 60 have enjoyed a post-tax income similar to that of mid-career working age Australians"
Study's findings on post-tax income, 2018/19-2022/23:
Mid-career working age Australians: $125K
Australians over 60: less than this
Australians over 75: $100K (20% less)
Study's findings on post-tax income, 2018/19-2022/23:
Mid-career working age Australians: $125K
Australians over 60: less than this
Australians over 75: $100K (20% less)
May 17, 2025 at 1:43 PM
ANU study: "Australians over the age of 60 have enjoyed a post-tax income similar to that of mid-career working age Australians"
Study's findings on post-tax income, 2018/19-2022/23:
Mid-career working age Australians: $125K
Australians over 60: less than this
Australians over 75: $100K (20% less)
Study's findings on post-tax income, 2018/19-2022/23:
Mid-career working age Australians: $125K
Australians over 60: less than this
Australians over 75: $100K (20% less)
Without this blurring of lines, it is clear that changes to net public transfers have favoured both younger and older people, that is, those people who have always been net recipients of public transfers.
May 15, 2025 at 9:30 PM
Without this blurring of lines, it is clear that changes to net public transfers have favoured both younger and older people, that is, those people who have always been net recipients of public transfers.
This picture is only possible, however, because of the blurring of lines between the net public transfers received by younger people and the net public transfers paid by working-age people.
May 15, 2025 at 9:30 PM
This picture is only possible, however, because of the blurring of lines between the net public transfers received by younger people and the net public transfers paid by working-age people.
The picture painted by the Varela et al figure is one in which changes to net public transfers have largely favoured older people and older people alone.
May 15, 2025 at 9:30 PM
The picture painted by the Varela et al figure is one in which changes to net public transfers have largely favoured older people and older people alone.
Grouping together these increases in net public transfers paid and received leads to the modest changes over time depicted in the Varela et al figure for working-age people. These modest changes, though, hide the substantial changes for younger people and working-age people identified in Rice et al.
May 15, 2025 at 9:30 PM
Grouping together these increases in net public transfers paid and received leads to the modest changes over time depicted in the Varela et al figure for working-age people. These modest changes, though, hide the substantial changes for younger people and working-age people identified in Rice et al.
The trends over time for working-age people in the Varela et al figure are also, in a rough sense, the result of grouping together the increases in net public transfers paid by working-age people and the increases in net public transfers received by younger people, as identified in Rice et al.
May 15, 2025 at 9:30 PM
The trends over time for working-age people in the Varela et al figure are also, in a rough sense, the result of grouping together the increases in net public transfers paid by working-age people and the increases in net public transfers received by younger people, as identified in Rice et al.
The lines for working-age people in this figure are, in a rough sense, the result of grouping together the lines for younger and working-age people in the figure from Rice et al.
May 15, 2025 at 9:30 PM
The lines for working-age people in this figure are, in a rough sense, the result of grouping together the lines for younger and working-age people in the figure from Rice et al.
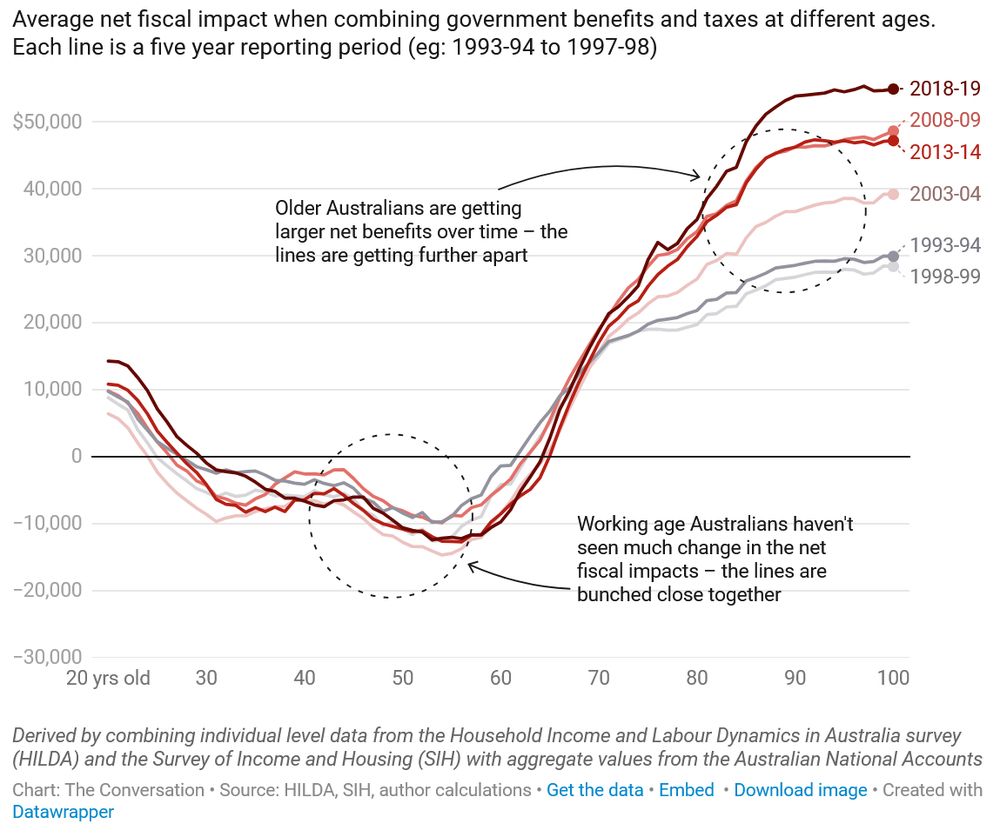
Here is the figure from Varela et al. I assume the vertical axis should read "transfer payments minus taxes".
The figure does not cover the entire life cycle, because public transfers received by children (like school education) are grouped together with those received by their working-age parents.
The figure does not cover the entire life cycle, because public transfers received by children (like school education) are grouped together with those received by their working-age parents.

May 15, 2025 at 9:30 PM
Here is the figure from Varela et al. I assume the vertical axis should read "transfer payments minus taxes".
The figure does not cover the entire life cycle, because public transfers received by children (like school education) are grouped together with those received by their working-age parents.
The figure does not cover the entire life cycle, because public transfers received by children (like school education) are grouped together with those received by their working-age parents.
The trends over time are straightforward. As incomes have risen over time, the amounts of net public transfers paid by working-age, net payers have increased, while the amounts of net public transfers received by younger and older, net recipients have also increased.
May 15, 2025 at 9:30 PM
The trends over time are straightforward. As incomes have risen over time, the amounts of net public transfers paid by working-age, net payers have increased, while the amounts of net public transfers received by younger and older, net recipients have also increased.
As this figure shows younger people are net recipients of public transfers, while working-age people are net payers of public transfers. Older people, like younger people, are net recipients of public transfers.
May 15, 2025 at 9:30 PM
As this figure shows younger people are net recipients of public transfers, while working-age people are net payers of public transfers. Older people, like younger people, are net recipients of public transfers.
Both papers include a figure that describes net public transfers (public transfers net of taxes) across the life cycle, where this difference can be seen.
Here is the figure from Rice et al.
Here is the figure from Rice et al.

May 15, 2025 at 9:30 PM
Both papers include a figure that describes net public transfers (public transfers net of taxes) across the life cycle, where this difference can be seen.
Here is the figure from Rice et al.
Here is the figure from Rice et al.
In contrast, in Varela et al public transfers intended to benefit children are allocated to their parents, rather than to the children themselves. For example, increases in public resourcing of schools are allocated to working-age people who do not attend these schools (the parents).
May 15, 2025 at 9:30 PM
In contrast, in Varela et al public transfers intended to benefit children are allocated to their parents, rather than to the children themselves. For example, increases in public resourcing of schools are allocated to working-age people who do not attend these schools (the parents).
One of the most important differences relates to the treatment of children. In Rice et al public transfers are allocated to the intended beneficiaries of the transfers, including children. For example, increases in public resourcing of schools are allocated to students at these schools.
May 15, 2025 at 9:30 PM
One of the most important differences relates to the treatment of children. In Rice et al public transfers are allocated to the intended beneficiaries of the transfers, including children. For example, increases in public resourcing of schools are allocated to students at these schools.
Intergenerational inequality and the intergenerational state
Rice et al, 2021
doi.org/10.1007/s125...
rdcu.be/cylFh (full-text, view-only)
Measuring the changing size of intergenerational transfers in the Australian tax and transfer system
Varela et al, 2025
crawford.anu.edu.au/content-cent...
Rice et al, 2021
doi.org/10.1007/s125...
rdcu.be/cylFh (full-text, view-only)
Measuring the changing size of intergenerational transfers in the Australian tax and transfer system
Varela et al, 2025
crawford.anu.edu.au/content-cent...
May 15, 2025 at 9:30 PM
Intergenerational inequality and the intergenerational state
Rice et al, 2021
doi.org/10.1007/s125...
rdcu.be/cylFh (full-text, view-only)
Measuring the changing size of intergenerational transfers in the Australian tax and transfer system
Varela et al, 2025
crawford.anu.edu.au/content-cent...
Rice et al, 2021
doi.org/10.1007/s125...
rdcu.be/cylFh (full-text, view-only)
Measuring the changing size of intergenerational transfers in the Australian tax and transfer system
Varela et al, 2025
crawford.anu.edu.au/content-cent...
...Personally, I think it can be a good experience for sociologists to immerse themselves in a variety of social systems, where social norms and policies are different to those with which they are familiar. I hope the move is going well!
April 14, 2025 at 10:47 AM
...Personally, I think it can be a good experience for sociologists to immerse themselves in a variety of social systems, where social norms and policies are different to those with which they are familiar. I hope the move is going well!
I'm pretty good. I've been away from social media for a while, partly because of contracted work for the government on recent child care reforms. As a result, I only learned about your huge, intercontinental move very recently (following a path to Hong Kong previously travelled by Jack Barbalet)...
April 14, 2025 at 10:47 AM
I'm pretty good. I've been away from social media for a while, partly because of contracted work for the government on recent child care reforms. As a result, I only learned about your huge, intercontinental move very recently (following a path to Hong Kong previously travelled by Jack Barbalet)...