Jon Rothbaum
@jlrothbaum.bsky.social
530 followers
110 following
43 posts
Economist, U.S. Census Bureau,
Returned Peace Corps Volunteer, Ecuador
(All opinions are mine).
Posts
Media
Videos
Starter Packs
Pinned
Jon Rothbaum
@jlrothbaum.bsky.social
· Aug 31

PQ: Stata module to read, write, and manage Parquet files in
pq provides commands for working with Apache Parquet files in Stata. Parquet is a columnar storage file format designed to efficiently store and process large datasets. This package allows Stata users
ideas.repec.org
Jon Rothbaum
@jlrothbaum.bsky.social
· Jul 14


Jon Rothbaum
@jlrothbaum.bsky.social
· Jul 14
Jon Rothbaum
@jlrothbaum.bsky.social
· Jul 14
Jon Rothbaum
@jlrothbaum.bsky.social
· Jul 14

Jon Rothbaum
@jlrothbaum.bsky.social
· Jul 14
Jon Rothbaum
@jlrothbaum.bsky.social
· May 25

Jon Rothbaum
@jlrothbaum.bsky.social
· May 25
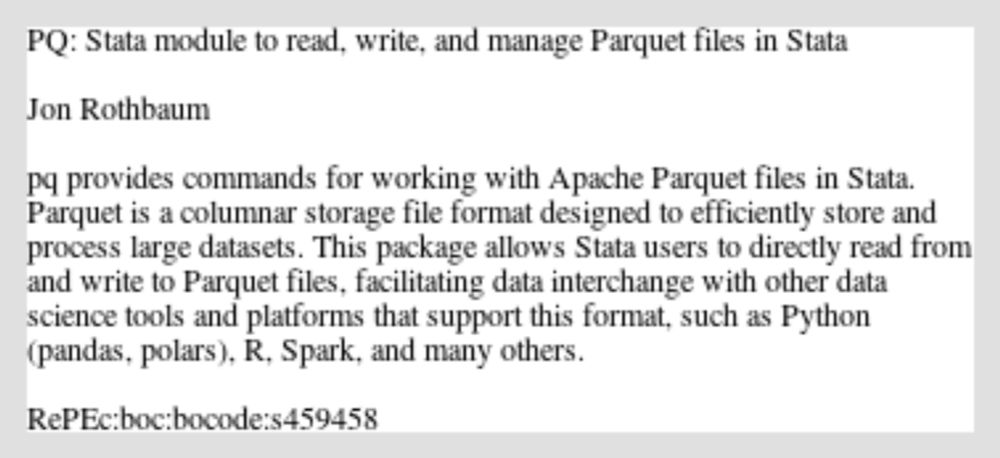
PQ: Stata module to read, write, and manage Parquet files in
pq provides commands for working with Apache Parquet files in Stata. Parquet is a columnar storage file format designed to efficiently store and process large datasets. This package allows Stata users
ideas.repec.org
Jon Rothbaum
@jlrothbaum.bsky.social
· Jan 29
Jon Rothbaum
@jlrothbaum.bsky.social
· Jan 29