John Gramlich
@johngramlich.bsky.social
7K followers 960 following 1.3K posts
I'm an associate director at the Pew Research Center in Washington, DC. Follow us: @pewresearch.org. Learn more: https://www.pewresearch.org/
Posts Media Videos Starter Packs
johngramlich.bsky.social
Since March, Democrats and Republicans alike have become more likely to say that Trump is favoring the Israelis too much. But while that's now the majority view among Democrats (57% say this), it's still very much the minority view among Republicans (18%). www.pewresearch.org/politics/202...
Bar chart showing an increase since March in the share of Americans who say Donald Trump is favoring the Israelis too much in the Israel-Hamas conflict. Americans in both parties have become more likely to express this view. The chart is based on Pew Research Center surveys of U.S. adults.
johngramlich.bsky.social
Americans under 30 are the most likely age group to say the US is providing too much military assistance to Israel and too little humanitarian assistance to Palestinian citizens. www.pewresearch.org/politics/202...
Bar chart showing age and party differences in Americans' views of whether the United States is providing too much, about the right amount or not enough military assistance to Israel. The chart is based on a September 2025 Pew Research Center survey of U.S. adults. Bar chart showing age and party differences in Americans' views of whether the United States is providing too much, about the right amount or not enough humanitarian assistance to Palestinian citizens. The chart is based on a September 2025 Pew Research Center survey of U.S. adults.
johngramlich.bsky.social
A majority of Democrats in the US now say Israel's military operation against Hamas is "going too far."

45% said this in December 2023
50% in September 2024
60% in September 2025

www.pewresearch.org/politics/202...
Bar chart showing how U.S. public opinion about Israel's military campaign against Hamas has changed since December 2023, both among Americans overall and by party. The chart is based on Pew Research Center surveys of U.S. adults.
johngramlich.bsky.social
Costco plans to sell Ozempic and Wegovy at a discount: www.washingtonpost.com/health/2025/... (via @washingtonpost.com)

This chart shows the huge, US-driven increase in global sales of these weight-loss drugs in recent years: www.pewresearch.org/short-reads/...
Area chart showing a dramatic increase in combined annual sales of Ozempic, Rybelsus and Wegovy from 2018 to 2023. The chart is based on a Pew Research Center analysis of annual reports from Novo Nordisk.
johngramlich.bsky.social
John Roberts received 78 "yes" votes when the Senate confirmed him as chief justice two decades ago. No other justice has received as much Senate support since then. The last four confirmed justices (KBJ, Barrett, Kavanaugh, Gorsuch) each got 54 or fewer "yes" votes. www.senate.gov/legislative/...
Screenshot of a U.S. Senate website showing confirmation votes for Supreme Court nominees since 2005.
johngramlich.bsky.social
The US Supreme Court returns today for its new term, two decades after John Roberts became chief justice. As this chart shows, public views of the court are much more negative – and far more politically divided – than 20 years ago. www.pewresearch.org/short-reads/...
Line chart showing how public opinion of the U.S. Supreme Court has changed in recent decades, both among Americans overall and among Republicans and Democrats. The chart is based on Pew Research Center surveys of U.S. adults.
johngramlich.bsky.social
As Bari Weiss becomes the new editor of CBS News, 30% of Americans say they regularly get news there.

39% say they trust it as a news source (56% of Democrats vs. 23% of Republicans).

23% say they distrust it (40% of Republicans vs. 6% of Democrats).

www.pewresearch.org/journalism/f...
News Media Tracker
Pew Research Center’s News Media Tracker shows data on Americans’ awareness of, use of and trust in 30 major news sources to map out part of the U.S. media ecosystem.
www.pewresearch.org
johngramlich.bsky.social
So far at least, Americans are lukewarm about AI summaries in search results. Relatively few who have seen them think they're extremely or very useful (20%) or have a lot of trust in the information they get from them (6%). New data from @pewresearch.org: www.pewresearch.org/short-reads/...
Bar chart showing that 20% of Americans who have seen AI summaries in search results believe these summaries are extremely or very useful. Far more (52%) see them as somewhat useful, while 28% see them as not too or not at all useful. The chart is based on an August 2025 Pew Research Center survey of U.S. adults. Bar chart showing that 6% of Americans who have seen AI summaries in search results have a lot of trust in the information they get from these summaries. Another 48% have some trust in this information, while 34% have not too much trust and 12% have no trust at all. The chart is based on an August 2025 Pew Research Center survey of U.S. adults.
johngramlich.bsky.social
29% of Americans expect the economy to be better a year from now, but substantially more (46%) expect it to be worse: www.pewresearch.org/short-reads/...
johngramlich.bsky.social
A majority of Republicans (56%) say current economic conditions in the US are only fair or poor. Republicans have also become less optimistic about the future direction of the economy, as this chart shows. www.pewresearch.org/short-reads/...
Bar chart showing that a declining share of Republicans in the United States believe economic conditions will be better a year from now. The chart also shows that a broad majority of Democrats continue to believe that economic conditions will be worse a year from now. The chart is based on Pew Research Center surveys of U.S. adults.
johngramlich.bsky.social
NEW @pewresearch.org data on views of the economy:

26% of Americans say current economic conditions are excellent or good, while 74% say they're only fair or poor. As in the past, partisans' economic assessments are related to who's in the White House.

www.pewresearch.org/short-reads/...
Line chart showing partisan differences in Americans' assessments of national economic conditions, based on Pew Research Center surveys of U.S. adults between 2016 and 2025.
johngramlich.bsky.social
"Since 2022, Americans in many demographic groups have become more likely to view the widespread legalization of sports betting as a bad thing for society, as well as for sports." www.pewresearch.org/short-reads/...
Dot plot showing that across demographic groups in the U.S., a growing share of Americans believe that the widespread legalization of sports betting is a bad thing for society. The chart is based on Pew Research Center surveys of U.S. adults in 2022 and 2025.
johngramlich.bsky.social
NEW from @pewresearch.org: Public awareness of legal sports betting has grown in recent years – and so has the perception that it is a *bad thing* for society and sports. Young men, in particular, have changed their views.
Americans increasingly see legal sports betting as a bad thing for society and sports
Today, 43% of U.S. adults say the fact that sports betting is now legal in much of the country is a bad thing for society, up from 34% in 2022.
www.pewresearch.org
johngramlich.bsky.social
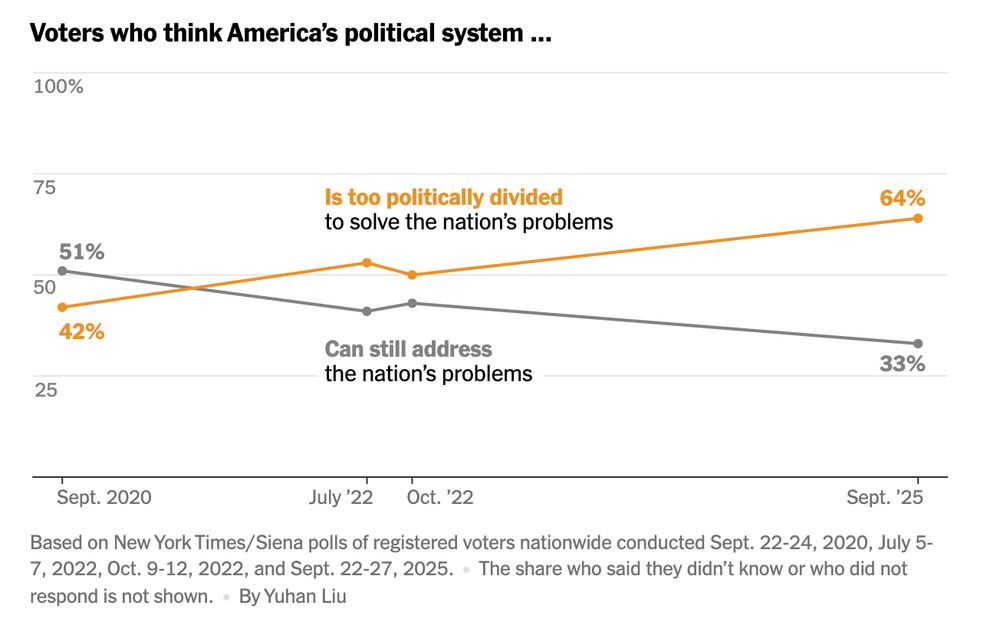
In a new @nytimes.com poll, 64% of registered voters say America's political system is too divided to solve the nation's problems, up from 42% in 2020. (Survey fielded in aftermath of Charlie Kirk assassination.) www.nytimes.com/2025/10/02/u...
Chart showing a considerable increase in the percentage of U.S. registered voters who say America's political system is too politically divided to solve the nation's problems. 64% of voters say this today, up from 42% in 2020. The chart is based on surveys conducted by The New York Times/Siena.
johngramlich.bsky.social
"Americans’ confidence in the mass media has edged down to a new low, with just 28% expressing a 'great deal' or 'fair amount' of trust in newspapers, television and radio to report the news fully, accurately and fairly." (via @gallup.com) news.gallup.com/poll/695762/...
Line chart showing Americans' trust in the mass media from 1972 to today, based on Gallup surveys of U.S. adults.
johngramlich.bsky.social
"In the nearly five decades that the current system for budgeting and spending tax dollars has been in place, Congress has passed all its required appropriations measures on time only four times." www.pewresearch.org/short-reads/...
Bar chart showing that Congress rarely passes all of its required spending bills on time. The chart is based on a Pew Research Center analysis of data from the Congressional Research Service.
Reposted by John Gramlich
maustermuhle.bsky.social
Want to get legally married or do some renovations on your historic Georgetown home? Well, you can't during the federal shutdown. There's plenty of quirky and profound ways that these shutdowns impact D.C. residents and the city's economy. For @51st.news: 51st.news/the-federal-...
The federal government has shut down. Here’s what it means for D.C.
You can’t legally get married, for one, and the city’s economy will take a hit.
51st.news
johngramlich.bsky.social
Net favorability of top Washington leaders

Trump: -18
Vance: -11
Johnson: -13
Thune: -10
Jeffries: -6
Schumer: -29

www.pewresearch.org/short-reads/...
Bar chart showing how Americans view President Donald Trump, Vice President JD Vance, House Speaker Mike Johnson, Senate Majority Leader John Thune, House Minority Leader Hakeem Jeffries and Senate Minority Leader Chuck Schumer. The chart is based on a September 2025 Pew Research Center survey of U.S. adults.
johngramlich.bsky.social
You replied to me, not to the person you're apparently disagreeing with.

Have a good evening!
johngramlich.bsky.social
You replied to me, so I thought you were talking to me.
johngramlich.bsky.social
The survey question asked whether Americans have a favorable or unfavorable opinion of Schumer or whether they haven't heard of him. No mention of shutdown, so no premise.