


Jonathan Kitt
@jonathankitt.bsky.social
🧬 Wheat genomics
📊 Data analysis & visualisation
🖥️ Computational biology
https://jonathankitt.netlify.app/blog
📊 Data analysis & visualisation
🖥️ Computational biology
https://jonathankitt.netlify.app/blog
#TidyTuesday week 05, exploring the Edible Plants Database.
Code available here: github.com/KittJonathan...
#RStats #Plants #Datavis #Code
Code available here: github.com/KittJonathan...
#RStats #Plants #Datavis #Code

February 3, 2026 at 12:52 PM
#TidyTuesday week 05, exploring the Edible Plants Database.
Code available here: github.com/KittJonathan...
#RStats #Plants #Datavis #Code
Code available here: github.com/KittJonathan...
#RStats #Plants #Datavis #Code

January 20, 2026 at 8:02 AM
Most spoken language families for the 24 countries taking part in the 2025 African Cup of Nations.
Code available here: github.com/KittJonathan...
#TidyTuesday #RStats #CAN #CAF #football
Code available here: github.com/KittJonathan...
#TidyTuesday #RStats #CAN #CAF #football

January 13, 2026 at 1:56 PM
Most spoken language families for the 24 countries taking part in the 2025 African Cup of Nations.
Code available here: github.com/KittJonathan...
#TidyTuesday #RStats #CAN #CAF #football
Code available here: github.com/KittJonathan...
#TidyTuesday #RStats #CAN #CAF #football
Just started reading the course materials from @physaliacourses.bsky.social on Genomic data (github.com/loukesio/dat...) by @bioinformatician.bsky.social, and already learned a couple valuable #tidyverse tricks!
- how to use "names_pattern" in pivot_longer()
- change labels using labeller()
#RStats
- how to use "names_pattern" in pivot_longer()
- change labels using labeller()
#RStats

January 8, 2026 at 3:56 PM
Just started reading the course materials from @physaliacourses.bsky.social on Genomic data (github.com/loukesio/dat...) by @bioinformatician.bsky.social, and already learned a couple valuable #tidyverse tricks!
- how to use "names_pattern" in pivot_longer()
- change labels using labeller()
#RStats
- how to use "names_pattern" in pivot_longer()
- change labels using labeller()
#RStats
First #tidytuesday for 2026! Decided to re-create my #github contributions heatmap for 2025.
Code available here: github.com/KittJonathan...
#Rstats #datavis #code
Code available here: github.com/KittJonathan...
#Rstats #datavis #code

January 6, 2026 at 9:28 AM
First #tidytuesday for 2026! Decided to re-create my #github contributions heatmap for 2025.
Code available here: github.com/KittJonathan...
#Rstats #datavis #code
Code available here: github.com/KittJonathan...
#Rstats #datavis #code

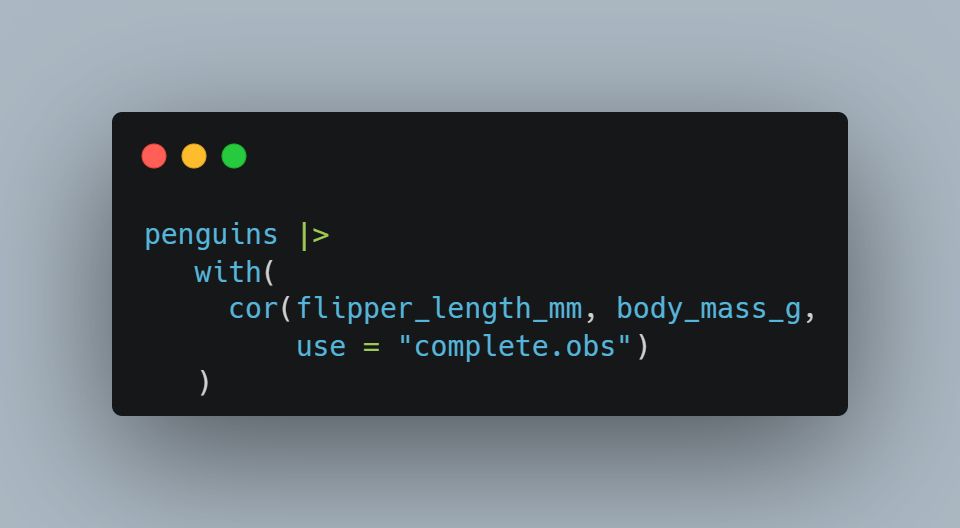
Wow ... I'd never come across this use of with(), which allows combining the pipe and computing a correlation coefficient. Thanks to @mansthulin.bsky.social for explaining this in his fantastic book www.modernstatisticswithr.com!
#Rstats #code #neverknew
#Rstats #code #neverknew
July 22, 2025 at 12:22 PM
Wow ... I'd never come across this use of with(), which allows combining the pipe and computing a correlation coefficient. Thanks to @mansthulin.bsky.social for explaining this in his fantastic book www.modernstatisticswithr.com!
#Rstats #code #neverknew
#Rstats #code #neverknew
Day 11 of the 2025 #30DayChartChallenge - "stripes".
Looking at global surface temperatures using data from @ourworldindata.org.
Code available in comments.
#Rstats #dataviz #code #data #showyourstripes
Looking at global surface temperatures using data from @ourworldindata.org.
Code available in comments.
#Rstats #dataviz #code #data #showyourstripes

April 11, 2025 at 1:17 PM
Day 11 of the 2025 #30DayChartChallenge - "stripes".
Looking at global surface temperatures using data from @ourworldindata.org.
Code available in comments.
#Rstats #dataviz #code #data #showyourstripes
Looking at global surface temperatures using data from @ourworldindata.org.
Code available in comments.
#Rstats #dataviz #code #data #showyourstripes
Day 10 of the 2025 #30DayChartChallenge ... 1/3 of the way through !! 🎉
Today's prompt is "Multimodal", and I had no idea which dataset to use, so I decided to create different normal distributions.
Code available in the comments.
#Rstats #distributions #datavis #code
Today's prompt is "Multimodal", and I had no idea which dataset to use, so I decided to create different normal distributions.
Code available in the comments.
#Rstats #distributions #datavis #code

April 10, 2025 at 7:59 AM
Day 10 of the 2025 #30DayChartChallenge ... 1/3 of the way through !! 🎉
Today's prompt is "Multimodal", and I had no idea which dataset to use, so I decided to create different normal distributions.
Code available in the comments.
#Rstats #distributions #datavis #code
Today's prompt is "Multimodal", and I had no idea which dataset to use, so I decided to create different normal distributions.
Code available in the comments.
#Rstats #distributions #datavis #code
Day 9 of the #30DayChartChallenge - "Diverging".
Code available in comments.
#Rstats #datavis #code #penguins
Code available in comments.
#Rstats #datavis #code #penguins

April 9, 2025 at 7:06 AM
Day 9 of the #30DayChartChallenge - "Diverging".
Code available in comments.
#Rstats #datavis #code #penguins
Code available in comments.
#Rstats #datavis #code #penguins
Day 8 of the 2025 #30DayChartChallenge - "Histogram".
Code available in comments.
#Rstats #datavis #code
Code available in comments.
#Rstats #datavis #code

April 8, 2025 at 6:48 AM
Day 8 of the 2025 #30DayChartChallenge - "Histogram".
Code available in comments.
#Rstats #datavis #code
Code available in comments.
#Rstats #datavis #code

Day 6 of the 2025 #30DayChartChallenge.
Used the "energy" dataset included in the {tidyplots} package.
Code available in comments.
#Rstats #datavis #code
Used the "energy" dataset included in the {tidyplots} package.
Code available in comments.
#Rstats #datavis #code

April 6, 2025 at 12:01 PM
Day 6 of the 2025 #30DayChartChallenge.
Used the "energy" dataset included in the {tidyplots} package.
Code available in comments.
#Rstats #datavis #code
Used the "energy" dataset included in the {tidyplots} package.
Code available in comments.
#Rstats #datavis #code
Day 5 of the 2025 #30DayChartChallenge, using the #animals dataset included in the #tidyplots package to look at the speed of mammals.
Code available in the comments.
#Rstats #datavis #code
Code available in the comments.
#Rstats #datavis #code

April 5, 2025 at 9:40 AM
Day 5 of the 2025 #30DayChartChallenge, using the #animals dataset included in the #tidyplots package to look at the speed of mammals.
Code available in the comments.
#Rstats #datavis #code
Code available in the comments.
#Rstats #datavis #code
Day 4 of the 2025 #30DayChartChallenge, "Big or small?".
Been using the great #tidyplots package (@jbengler.de) so far, with the great {palmerpenguins} dataset (@apreshill.com & @allisonhorst.bsky.social).
Code available in comments below.
#Rstats #datavis #penguins #code
Been using the great #tidyplots package (@jbengler.de) so far, with the great {palmerpenguins} dataset (@apreshill.com & @allisonhorst.bsky.social).
Code available in comments below.
#Rstats #datavis #penguins #code

April 4, 2025 at 6:28 AM
Day 4 of the 2025 #30DayChartChallenge, "Big or small?".
Been using the great #tidyplots package (@jbengler.de) so far, with the great {palmerpenguins} dataset (@apreshill.com & @allisonhorst.bsky.social).
Code available in comments below.
#Rstats #datavis #penguins #code
Been using the great #tidyplots package (@jbengler.de) so far, with the great {palmerpenguins} dataset (@apreshill.com & @allisonhorst.bsky.social).
Code available in comments below.
#Rstats #datavis #penguins #code
Day 3 of the #30DayChartChallenge, with a #donut to represent counts, still using the #palmerpenguins dataset.
Link to code in comments.
#Rstats #datavis #code
Link to code in comments.
#Rstats #datavis #code

April 3, 2025 at 5:41 AM
Day 3 of the #30DayChartChallenge, with a #donut to represent counts, still using the #palmerpenguins dataset.
Link to code in comments.
#Rstats #datavis #code
Link to code in comments.
#Rstats #datavis #code
Day 2 of the #30DayChartChallenge, with a scatter plot and regression lines.
Code available in the comments below.
#Rstats #datavis #code
Code available in the comments below.
#Rstats #datavis #code

April 2, 2025 at 8:27 AM
Day 2 of the #30DayChartChallenge, with a scatter plot and regression lines.
Code available in the comments below.
#Rstats #datavis #code
Code available in the comments below.
#Rstats #datavis #code
Kicking off the #30DayChartChallenge with a simple stacked bar plot using the #PalmerPenguins package. My personal challenge this year is to use the #tidyplots package by @jbengler.de for as many plots as possible.
Code available in comments below.
#RStats #datavis #code
Code available in comments below.
#RStats #datavis #code

April 1, 2025 at 7:55 AM
Kicking off the #30DayChartChallenge with a simple stacked bar plot using the #PalmerPenguins package. My personal challenge this year is to use the #tidyplots package by @jbengler.de for as many plots as possible.
Code available in comments below.
#RStats #datavis #code
Code available in comments below.
#RStats #datavis #code

March 28, 2025 at 3:19 PM

Had never noticed that until today ... When creating a count table in R with table(), if you use View() then the table will be displayed in long format with non-existing combinations defined as 0!
#Rstats #code #palmerpenguins
#Rstats #code #palmerpenguins

February 27, 2025 at 1:53 PM
Had never noticed that until today ... When creating a count table in R with table(), if you use View() then the table will be displayed in long format with non-existing combinations defined as 0!
#Rstats #code #palmerpenguins
#Rstats #code #palmerpenguins

December 27, 2024 at 2:13 PM

November 15, 2024 at 10:56 AM